


As the price of Bitcoin rises, more and more on-chain signals indicate that the cryptocurrency market is overheating. These signals are proving particularly relevant in the context of the upcoming Bitcoin halving.
BeInCrypto presents 4 on-chain signals that indicate the possibility of an impending correction. This is particularly relevant from the perspective of current price developments, which have numerous similarities to the 2019 fractal.
At that time, BTC price also experienced a strong uptrend, only to experience a deep correction a few months before the halving. Does on-chain data support these predictions? Will the halving period correlate with a drop in Bitcoin price?
On-chain signals: NUPL enters the faith region
In addition to the numerous technical similarities between the current Bitcoin market situation and the 2019 fractal, on-chain analysis also points to parallels. The first two on-chain signals concern the famous Net Unrealized Profit/Loss (NUPL) indicator.
NUPL is the difference between the relative unrealized profit and the relative unrealized loss. This ratio can also be calculated by subtracting realized capitalization from market capitalization and dividing the result by market capitalization. In addition, NUPL comes in several variants: for all market investors, for long-term holders (LTH) and for short-term holders (STH).
Read more: Bitcoin Halving Cycles and Investment Strategies: What You Should Know
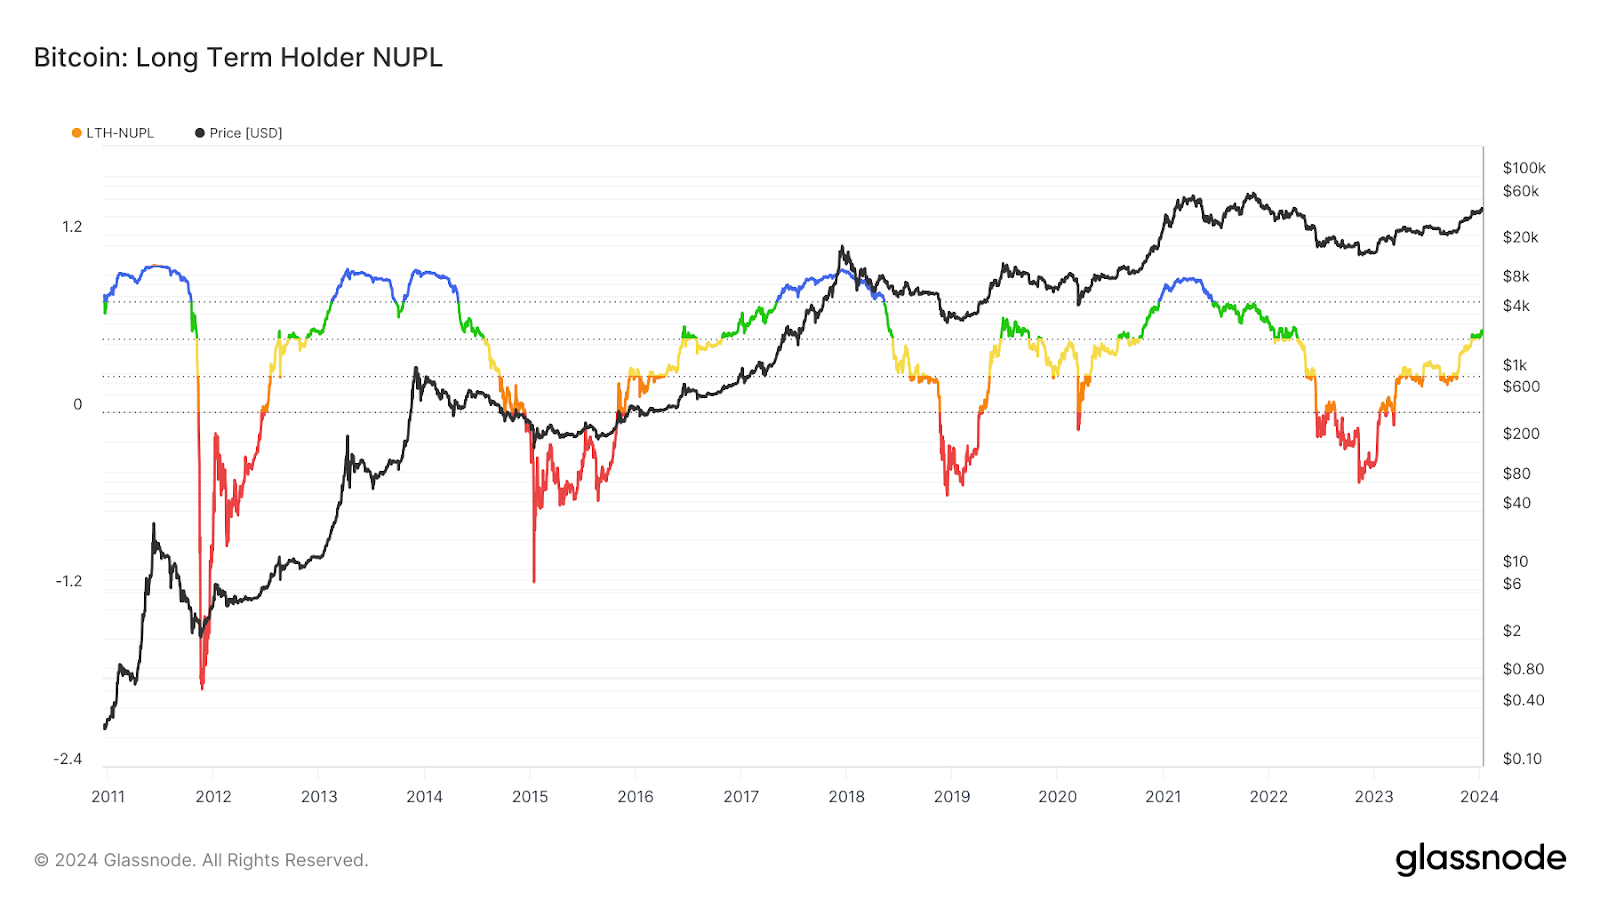
In the base index version chart, we see that NUPL is in the green belief zone in December 2023 and January 2024. During a mature bull market, this area signals a healthy market in a strong uptrend.
However, historically, the first entry into this area after recording a macro low in previous cycles (red circles) indicates an impending correction. In fact, declines occurred fairly quickly after the belief range was first reached (blue circles). Then the NUPL would return to the yellow zone of optimism.
NUPL vs. Bitcoin price / Source: Glassnode
However, in 2019 and early 2020, NUPL fell again to lows in the orange (hope) and even red (surrender) zones. If history were to rhyme, then even now – after a short-term presence in the green – the coming correction on the NUPL chart could indicate a decline in the Bitcoin price.
It is worth noting that an analogous situation can be seen on the NUPL chart for long-term hodlers (LTH). This category includes addresses that hold their assets for at least 155 days. The first brief visit to the green after the macro lows also led to a correction.
Realized gains are reminiscent of the 2019 outbreak
The on-chain signals we analyzed are also considered indicators correlated with NUPL, but instead of showing unrealized gains/losses, they show realized ones. Net Realized Profit/Loss is the net profit or loss of all coins transferred and is defined as the difference between realized profit and realized loss.
The higher the graph reaches the green area, the higher the realized profits of Bitcoin market participants. Conversely, many investors sell BTC when the red bars are long, thereby realizing a loss.
We see a major breakout on the Net Realized Profit/Loss indicator chart. It follows a long-term upward trend and is similar to the situation in 2019 (blue circles). In the previous cycle, this resulted in a 53% correction, which was later exacerbated by the COVID-19 crash (red arrow).
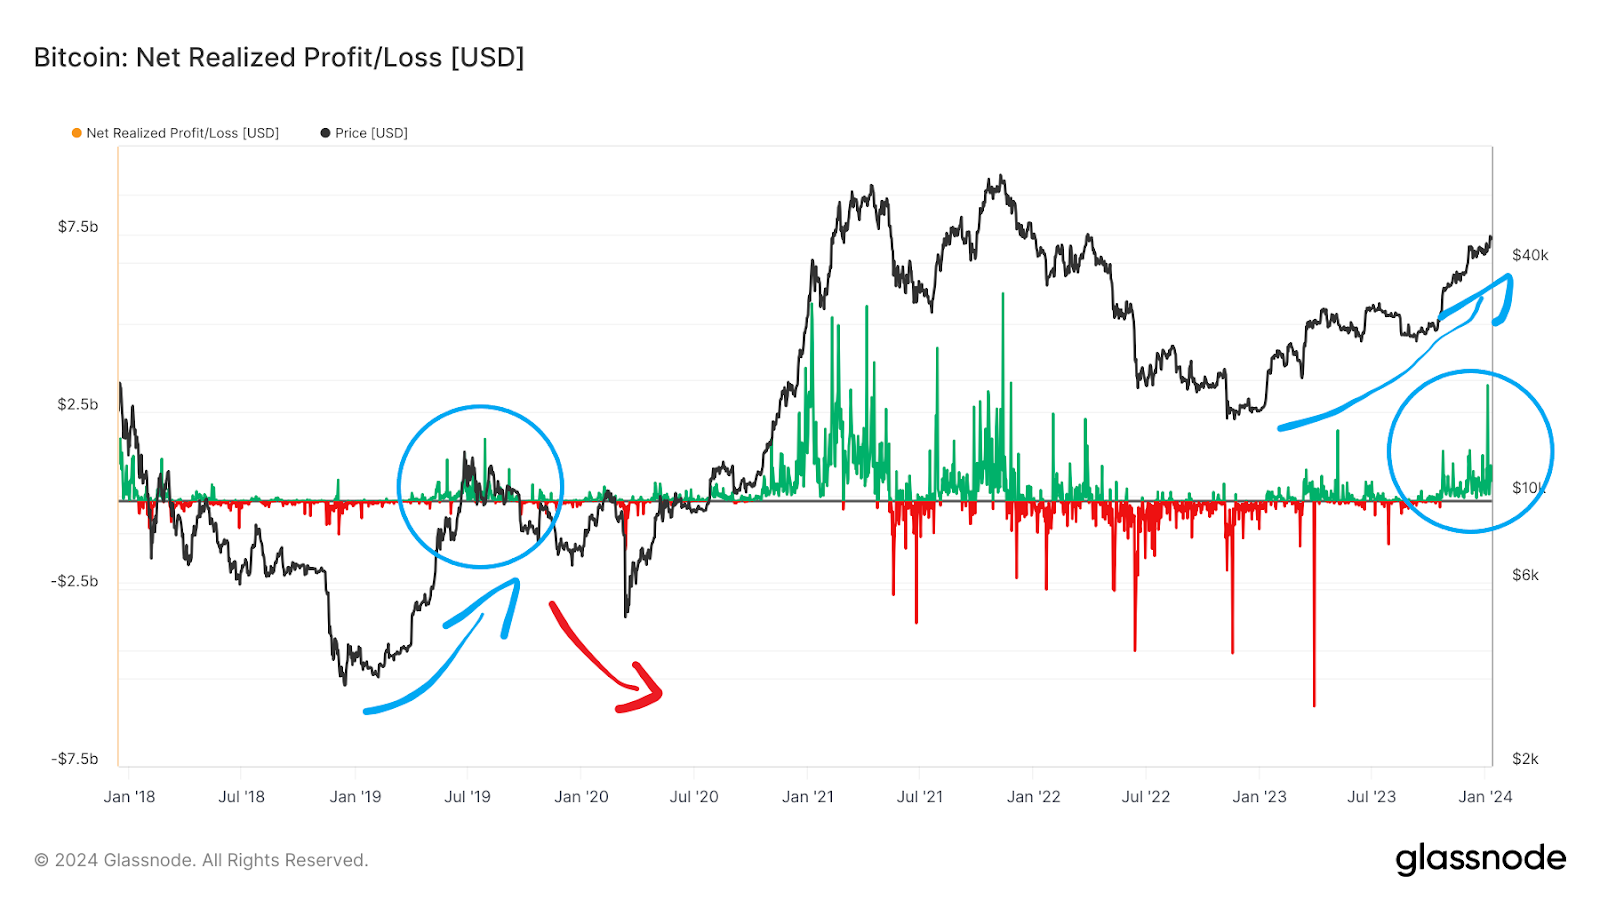
If a similar scenario occurs, Bitcoin price could return to the $23,000-$28,000 range before resuming the uptrend. This is even more likely because, like in 2019, the breakout occurs a few months before the Bitcoin halving.
On-Chain Signals: UTXO’s profit percentage enters oversold territory
The final on-chain signal that indicates the possibility of an impending BTC price correction is UTXO’s profit share. This is simply the percentage of unspent transaction outputs (UTXOs) that were priced lower than the current price at the time of creation. In other words, this indicator shows what percentage of BTC addresses are currently making profits.
The long-term chart shows that the value above 95% is marked in red. Here too – in a strong uptrend – almost all UTXOs are in profit. Additionally, since Bitcoin is at an all-time high (ATH), 100% of UTXOs are making profits.
On the other hand, the situation on this chart in 2019 after the recovery from the macro lows of the previous cycle is similar to the signals on the NUPL chart. The timing before the next Bitcoin halving is also similar. We see a short-term visit to the red oversold zone, followed by a correction.
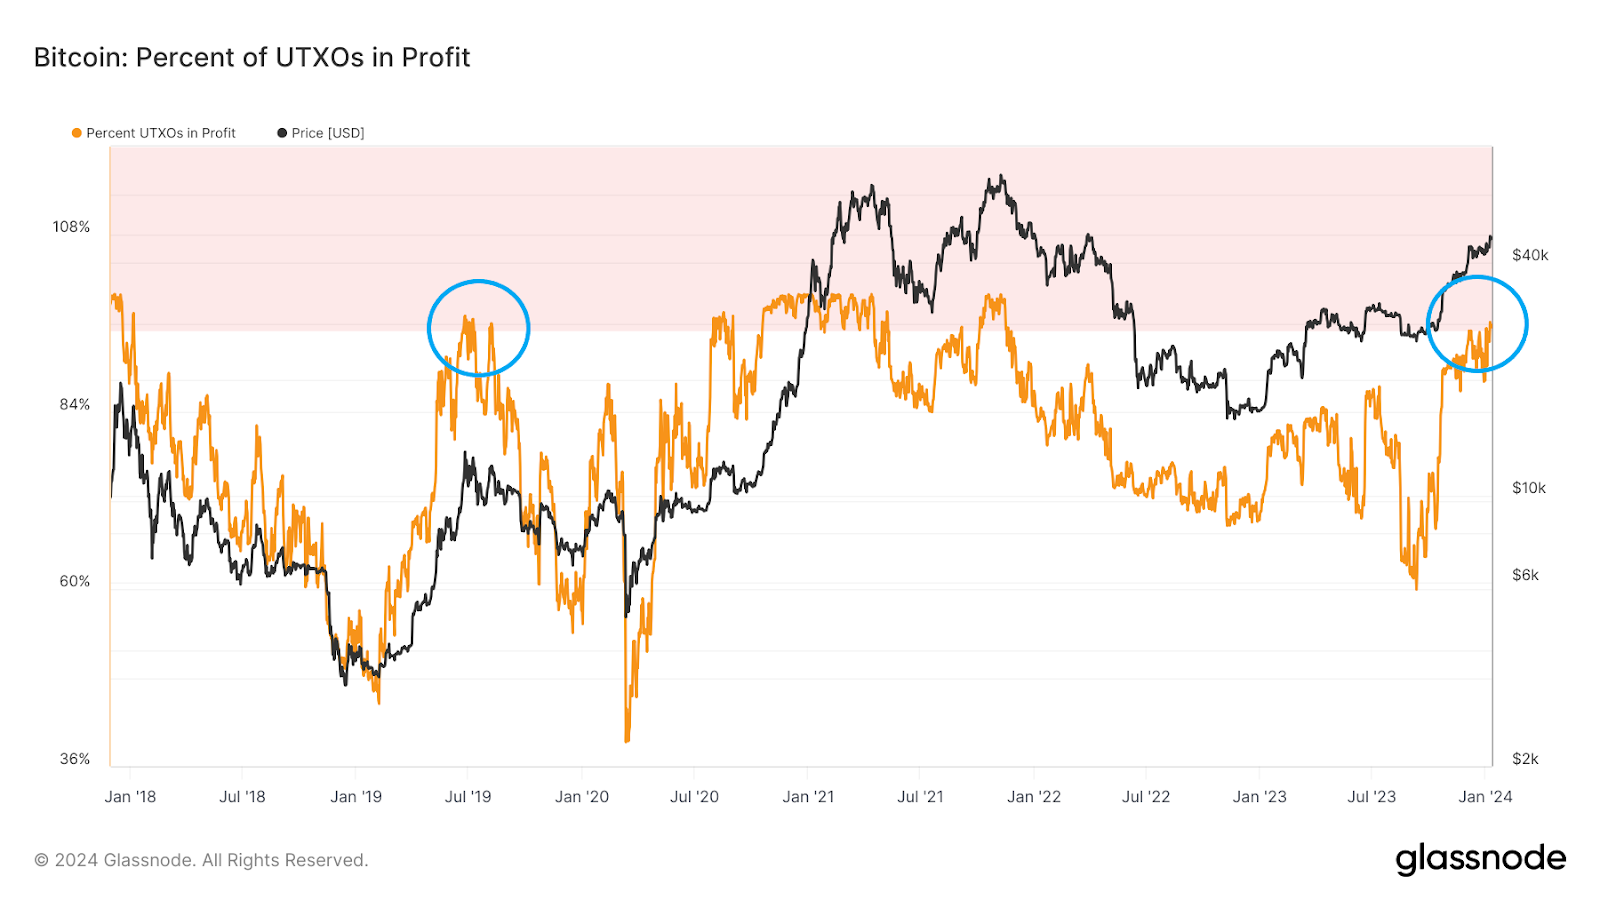
If the scenario repeats itself, the first quarter of 2024 could be a period of decline in the cryptocurrency market. This is especially possible given the pre-halving hype and euphoria following the approval of the spot Bitcoin ETF.
Read more: What is Bitcoin Halving?
For BeInCrypto's latest crypto market analysis: Click here.
Disclaimer
In accordance with Trust Project policies, this pricing analysis article is for informational purposes only and should not be considered financial or investment advice. BeInCrypto is committed to accurate, unbiased reporting, but market conditions are subject to change without notice. Always do your own research and consult a professional before making any financial decisions. Please note that our Terms and Conditions, Privacy Policy and Disclaimers have been updated.
Learn Crypto Trading, Yield Farms, Income strategies and more at CrytoAnswers
https://nov.link/cryptoanswers
Comments are closed.