
Analysis of the current state of Ethereum, DeFi, stablecoins, NFTs after the FTX fallout


Price discount from ATH
2022 is nearing the end of the year; It was a historic year for all asset classes due to the rapid tightening of global monetary policy and the strength of the US dollar. This has had a severe impact on the crypto ecosystem, which has seen a multitude of liquidations and margin calls, as well as the collapse of FTX and Luna.
A mixed year for the Ethereum ecosystem saw a successful merger in September and as a result ETH was net deflationary in October. However, the magnitude of the losses from an investor perspective has been monumental in the DeFi ecosystem.
Ethereum is currently 73% below its all-time high and hovering around $1,200; With the fall of Luna in May and the collapse of FTX in November, 2022 saw significant liquidations and deleveraging.
(Source: Glassnode): Price Drawdown from ATH
Ethereum gas consumption from 2020 – 2022
Gas fees are the costs of completing a transaction or executing a contract. This could be, for example, exchanging into a stablecoin or minting an NFT.
Since the summer of 2020, Ethereum gas fees have increased mainly due to the explosion of DeFi usage on the chain.
Although network activity has decreased significantly since the summer of 2021, the problem that Ethereum is an expensive chain still prevails.
Ethereum gas fees are quoted in Gwei, a unit of measurement that is equivalent one billionth of an ETH. Gas costs fluctuate depending on network congestion, requiring times during peak demand when higher gas rates are required to push through a transaction.
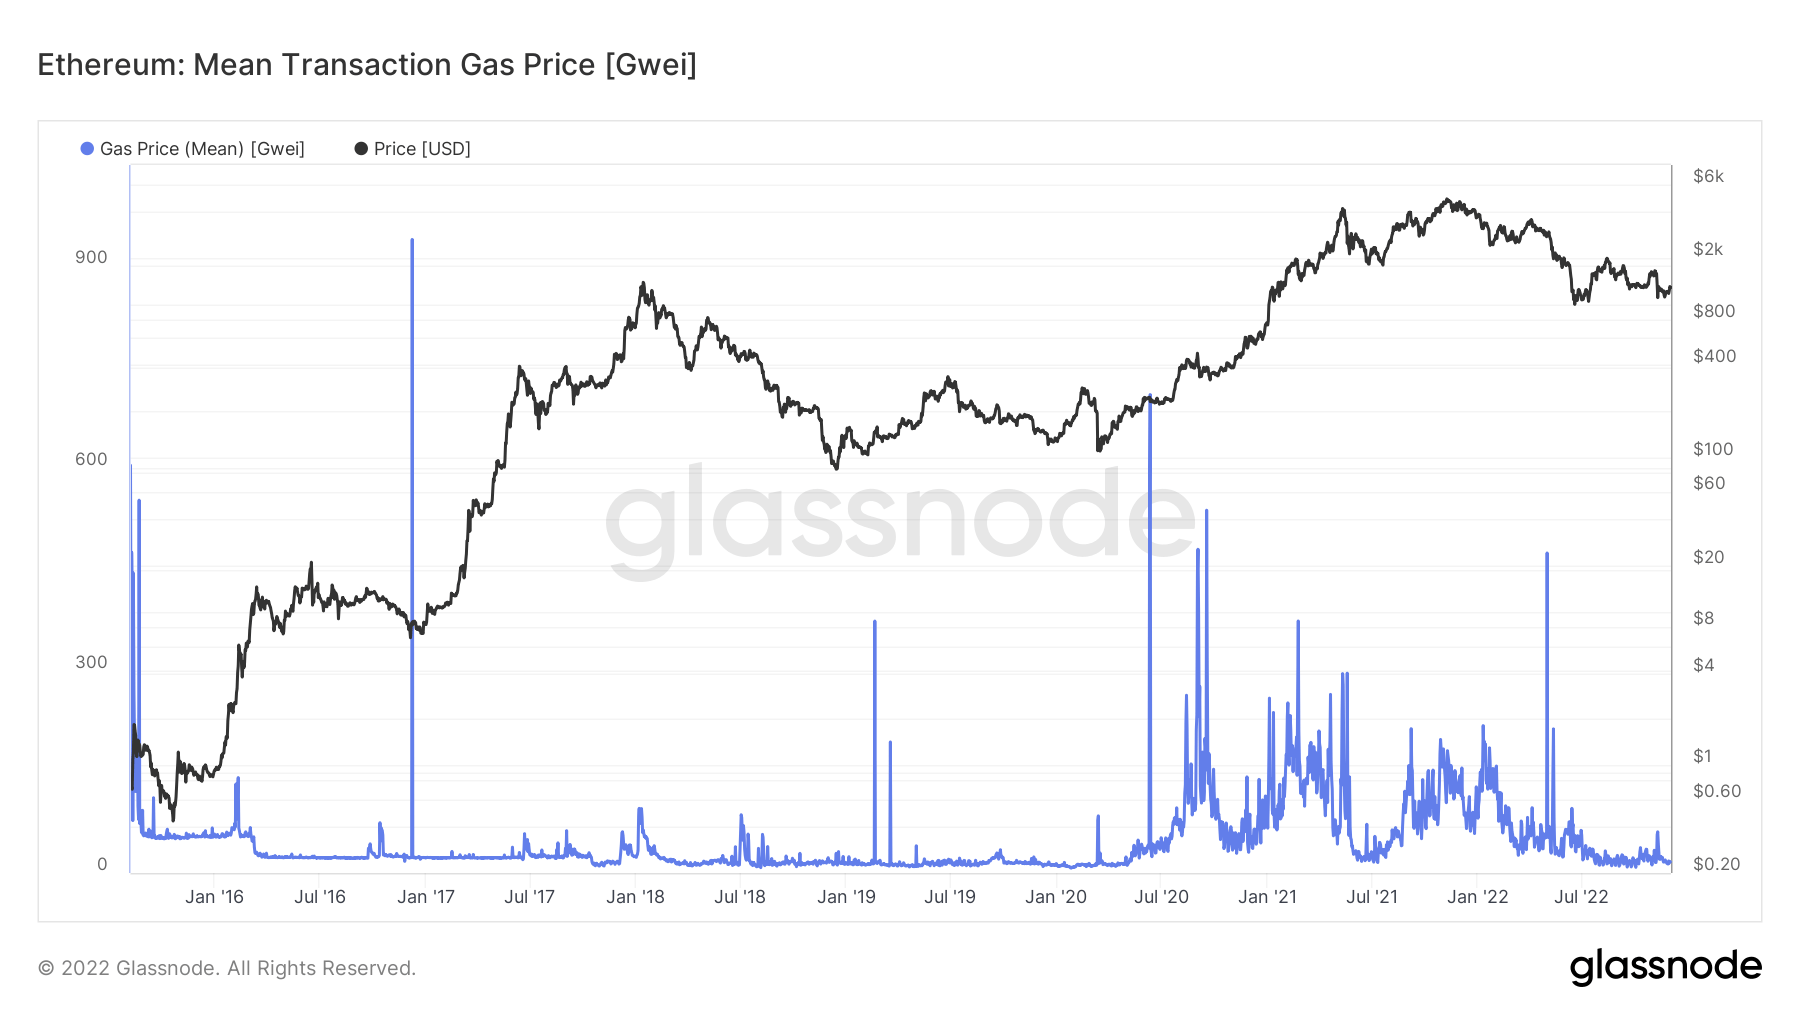 (Source: Glassnode): Mean Transaction Gas Price
Stablecoins are cryptocurrencies designed to minimize price volatility by being pegged to a benchmark. The reference value can be a commodity, a cryptocurrency or fiat money.
The market offers various stablecoins, such as B. Asset-backed, including fiat, crypto or precious metals assets, and algorithmic, which increase or subtract from the circulating token supply to bring the price to the desired level.
Current gas consumption for stablecoins is 7%, which has remained about the same for 2022; However, mass adoption of stablecoins began in early 2020, peaking at almost 20% of Ethereum gas consumption.
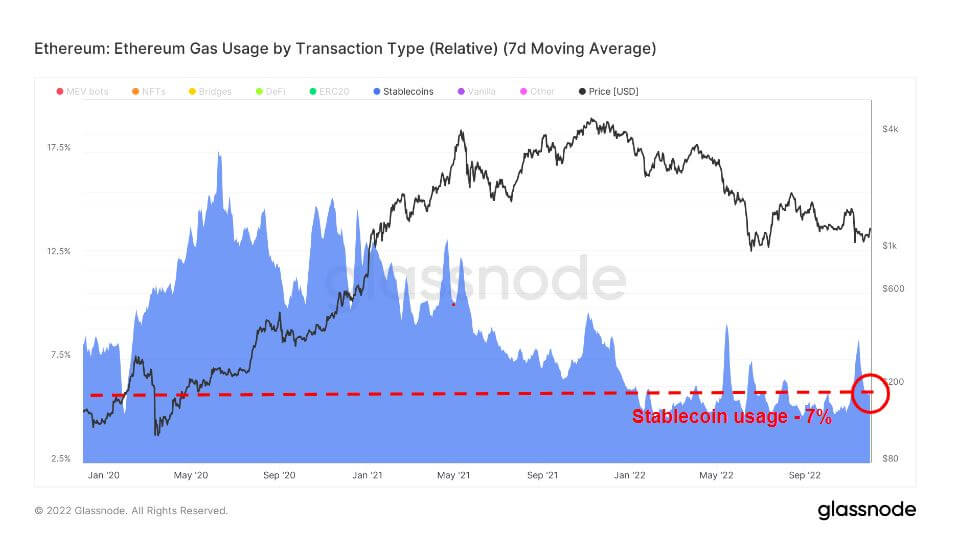 (Source: Glassnode): ETH gas consumption
Decentralized Finance (DeFi) is an emerging technology that will shut down banks and financial institutions and connect users directly to financial products, typically lending, trading and borrowing.
DeFi followed shortly after the stablecoin boom; as of July 2020, Uniswap emerged as the leading DeFi gas consumer, peaking around June 2021 before heading lower. DeFi usage has maintained an average of around 12% in 2022, which is above usage in early 2020.
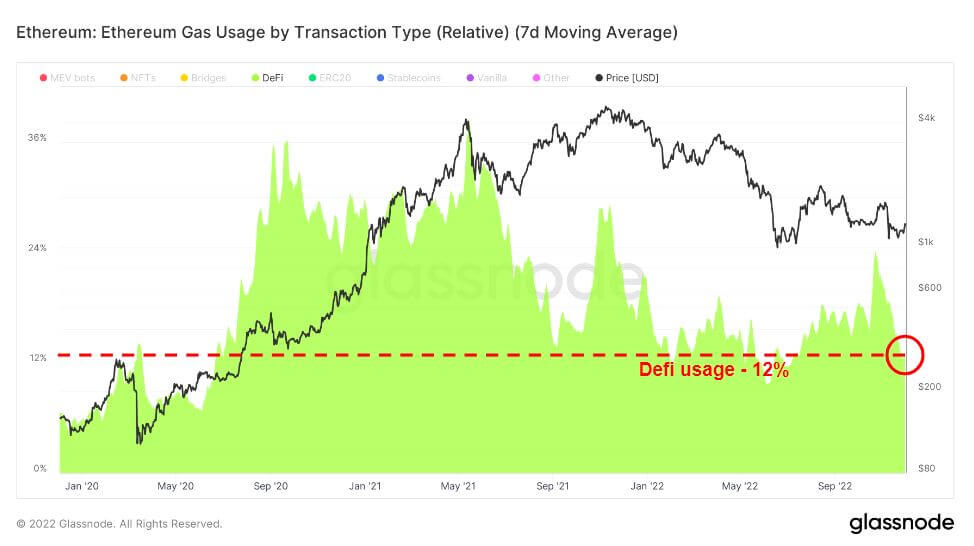 (Source: Glassnode): ETH gas consumption
Of the trifecta, NFTs were the last to boom this cycle, exploding in late 2021. As a result, OpenSea saw the most significant spikes in gas consumption from NFT demand during the 2021 bull run. From June 2022, however, demand has cooled down significantly, but remains slightly higher than in previous years.
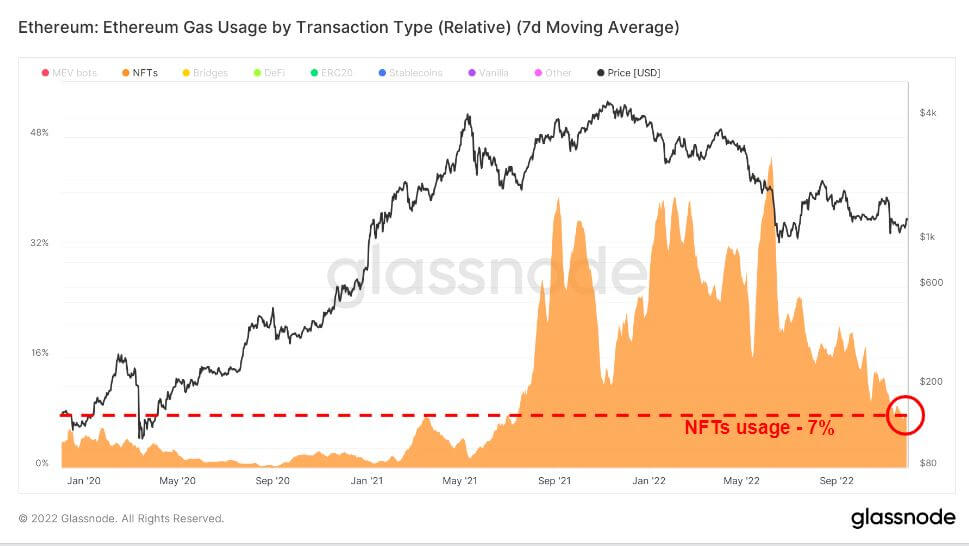 (Source: Glassnode): ETH gas consumption
Decline in the number of transactions and the price of gas
Ethereum gas consumption and transaction numbers are at yearly lows; The average gas price has been somewhat muted over the past four months, with slight increases due to the recent merger and FTX collapse. As the number of transactions nears year-to-date lows, it suggests that the bear market has taken its toll on users.
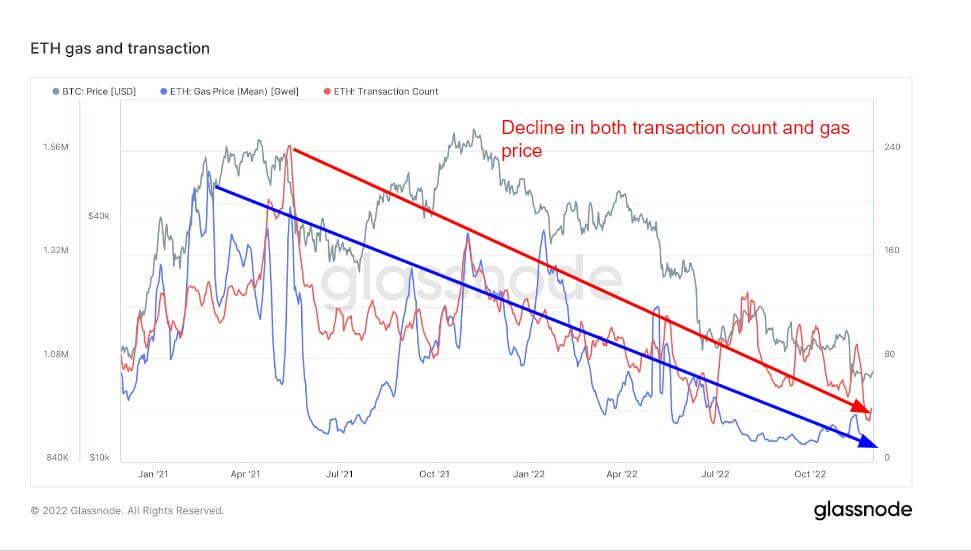 (Source: Glassnode): ETH gas and transactions
The Rise and Fall of TVL in DeFi (USD)
Total Value Locked (TVL) measures the total value of all assets locked in DeFi protocols. TVL is denominated in USD or ETH, while DeFi protocols offer lending, liquidity pooling, staking and more.
The chart below shows the total value of DeFi, which surpassed $240 billion in the summer of 2021 due to DeFi protocols’ ability to leverage, borrow, and use your crypto as collateral.
The 2021 bull and 2022 bear were not unprecedented in either year as central banks launched massive stimulus in 2020 that resulted in most of the debt and borrowing being wiped out in 2022.
During the Luna sell-off, TVL fell over $160 billion; Admittedly, there was a sell-off just before Luna during the peak of the bull run in November 2021, most likely investors pulled out of the ecosystem. Additionally, the collapse of FTX led to another $23 billion sell-off, taking TVL to around $70 billion, similar to early 2021.
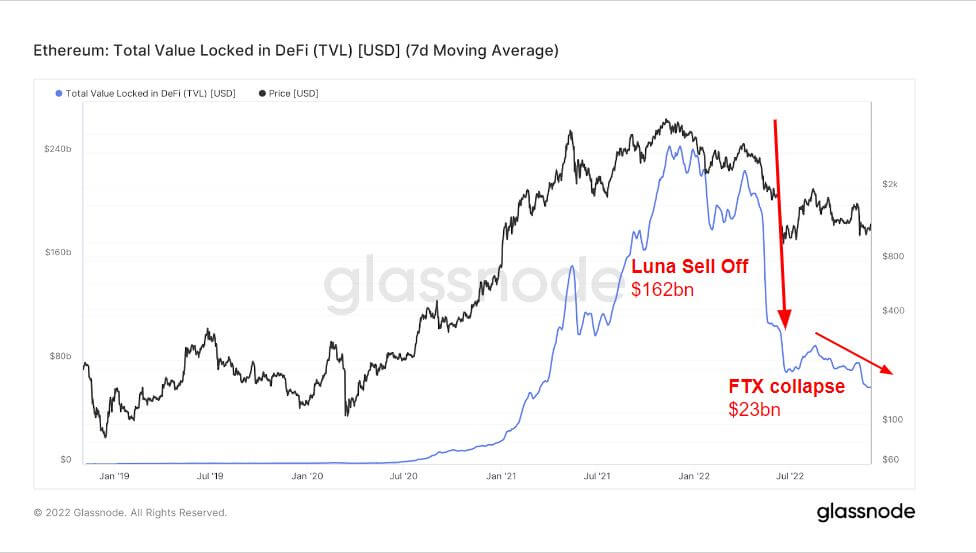 (Source: Glassnode): Total value in DeFi
Stablecoin performance as a result of FTX collapse
Ethereum’s dominance over the top four stablecoins has been in a downtrend since May, with stablecoins becoming more dominant in June – when ETH hit its lowest price of the year.
This chart compares Ethereum’s market cap to the combined value of the top four stablecoins USDT, USDC, BUSD and DAI. Note that supplies of these stablecoins are spread across multiple host blockchains, including Ethereum.
In June, the ETH market cap was lower than the top 4 stablecoin market caps due to Luna, and the same thing happened during the FTX collapse; but only a much smaller drop for a short time.
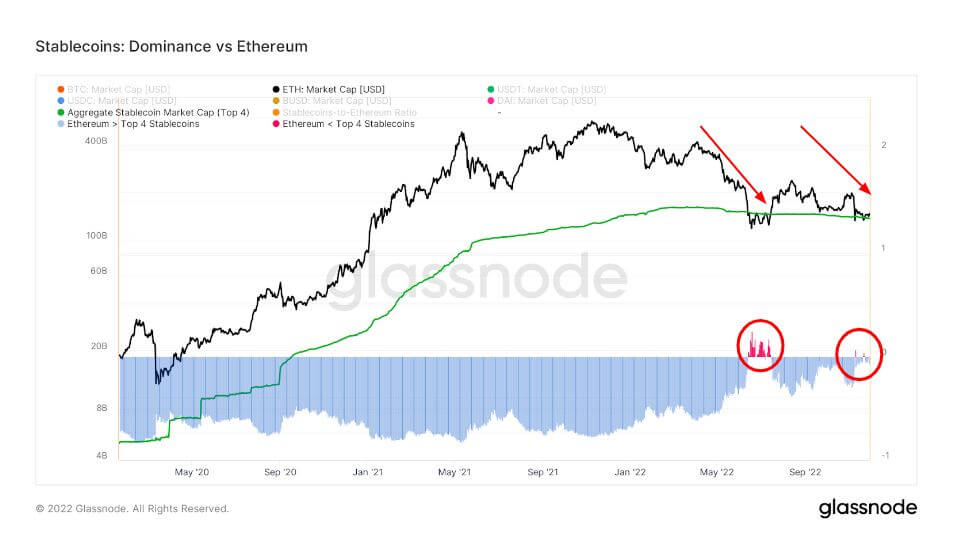 (Source: Glassnode): Stablecoins: Dominance vs. Ethereum
The chart below shows the total supply issued and held on Ethereum smart contracts. This chart shows the total supply held in smart contracts alongside individual tracks for the four major stablecoins USDT, USDC, BUSD and DAI.
Another noticeable trend in the stablecoin ecosystem is the sharp decline in the supply of smart contracts. Total supply at its peak was $44 billion; since the collapse of Luna and FTX, it’s now around $25 billion. A significant drop across all top 4 stablecoins as well.
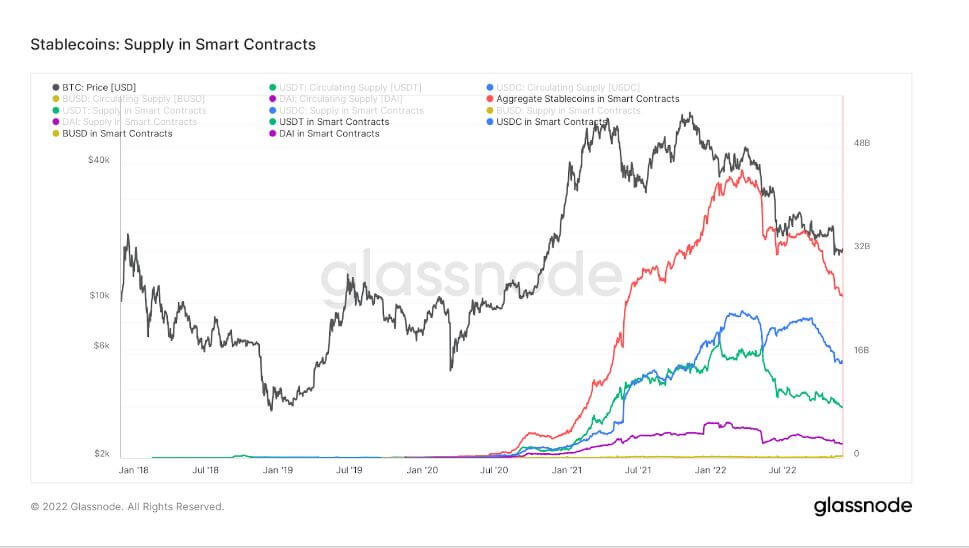 (Source: Glassnode): Delivery in Smart Contracts
Significant losses for Ethereum
Net Realized Profit/Loss is the net profit or loss of all coins spent that day. The price at which each issued coin was last moved and the current price allows calculating the USD value realized as a profit or loss by the owner.
Over the week during the FTX collapse, Ethereum realized over $20 billion in losses, adding $14 billion on Nov. 17, several times worse than Luna’s collapse for investors.
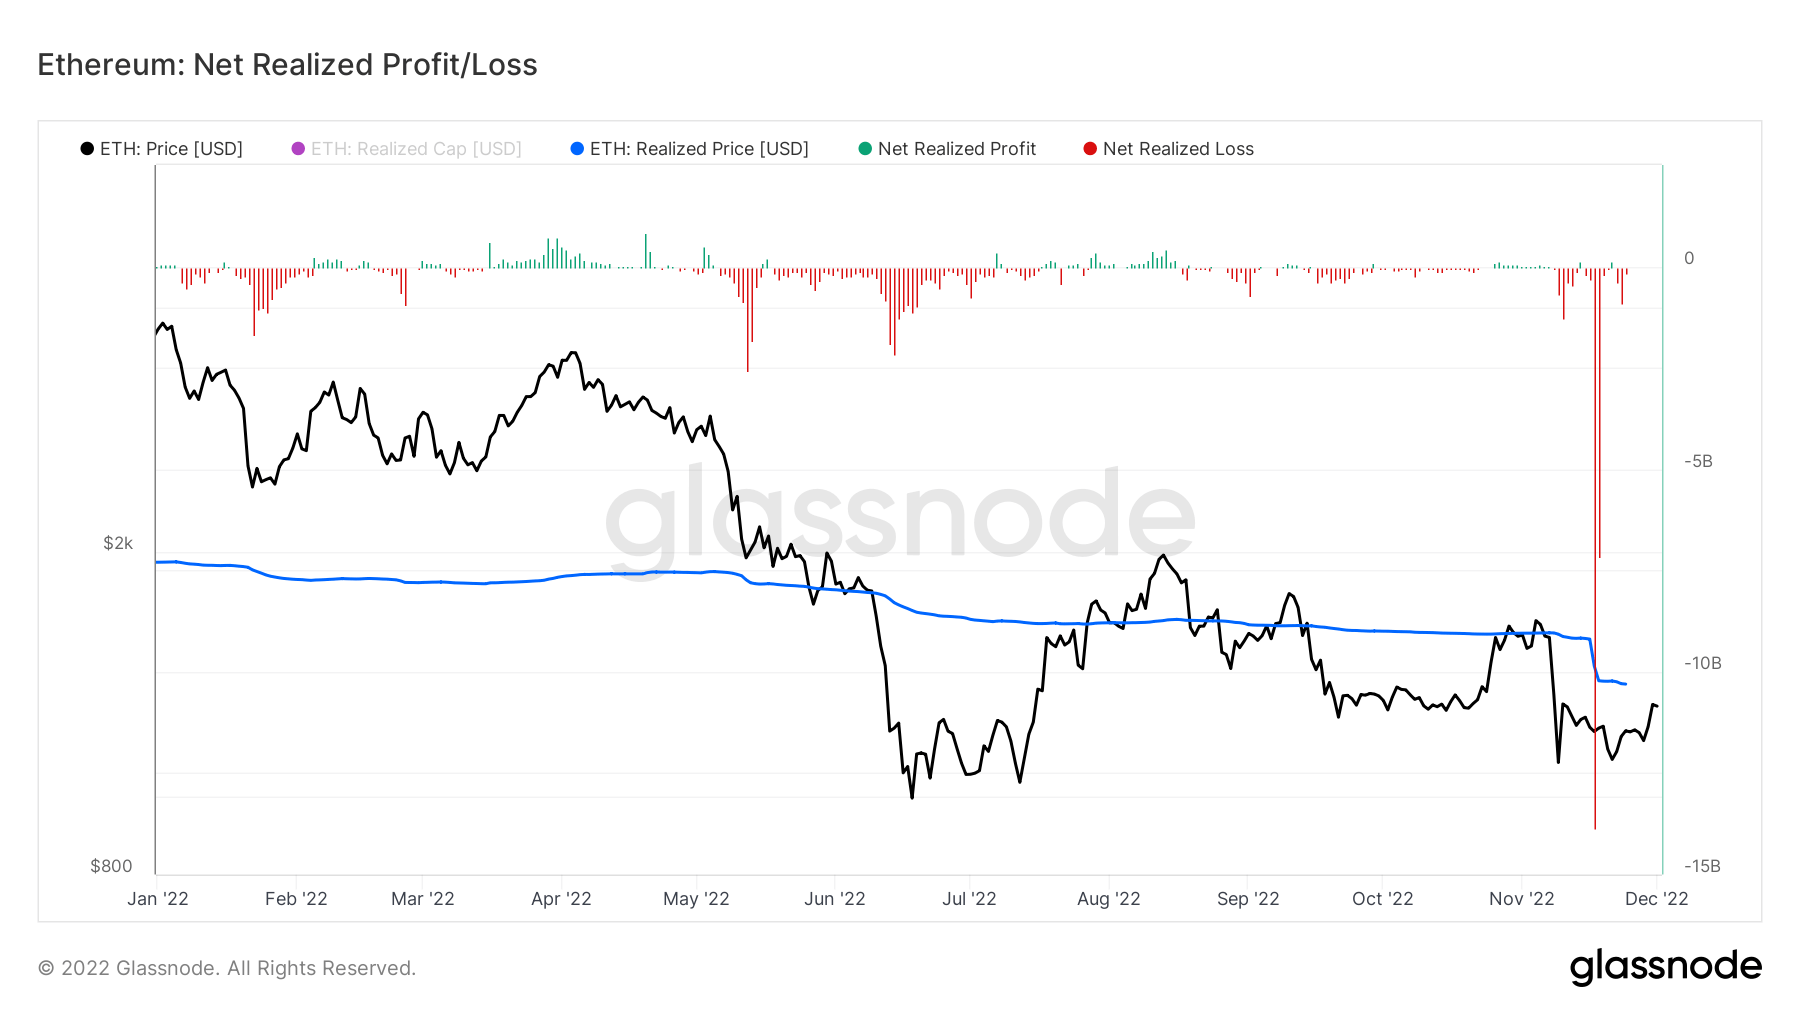 (Source: Glassnode): Net realized gain/loss
Learn Crypto Trading, Yield Farms, Income strategies and more at CrytoAnswers
https://nov.link/cryptoanswers
Comments are closed.