


- At press time, Bitcoin was trading at around $69,000
- Open interest figures stood at around $36 billion despite BTC’s price decline
After several days of uptrends, Bitcoin's recent rise above $71,000 sparked optimism among some traders. However, the subsequent drop below $70,000 sparked mixed sentiments, with buying and selling sentiment at comparable levels.
A weak bull trend?
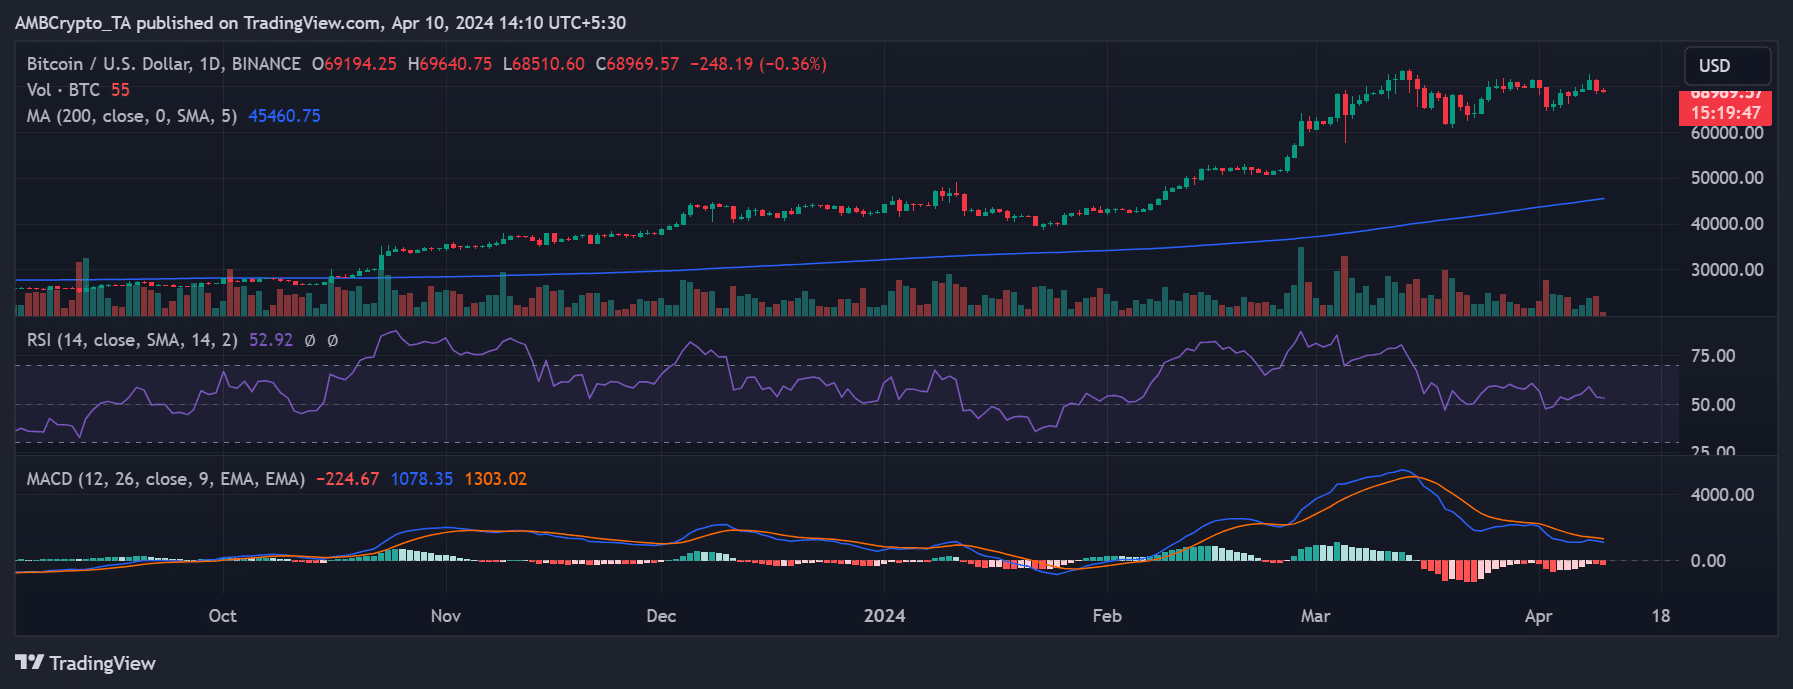
Bitcoin saw a significant pullback on April 9, deviating from the expected price trend with a decline of almost 3% on the charts. Analysis of the daily time frame price chart showed a decline to around $69,217 by the end of the trading session, down from the starting point of over $71,000.
This decline exceeded the previous day's gains of over 2.7%.
Source: TradingView
At the time of writing, this downward trend has continued, albeit slightly. The Relative Strength Index (RSI) line also appeared to be almost flat, hovering slightly above the neutral line. This position suggests that Bitcoin is still in an uptrend, but it is weak.
Buy or sell?
The aforementioned drop in Bitcoin price has sparked a huge debate about whether to buy or sell the asset. In fact, Santiment's social dominance and volume suggested a relatively balanced debate between these positions. Consider this: Social volume analysis found approximately 164 mentions of buying sentiment compared to 125 mentions of selling sentiment.
Additionally, a social dominance study found that buying sentiment was around 4.9% while selling sentiment was around 3.7%. Additionally, “Bitcoin halving” was the second most trending word at the time of writing. These metrics suggest that despite the price drop, traders remain largely focused on the potential impact of the upcoming halving.
Minimal activity in active addresses
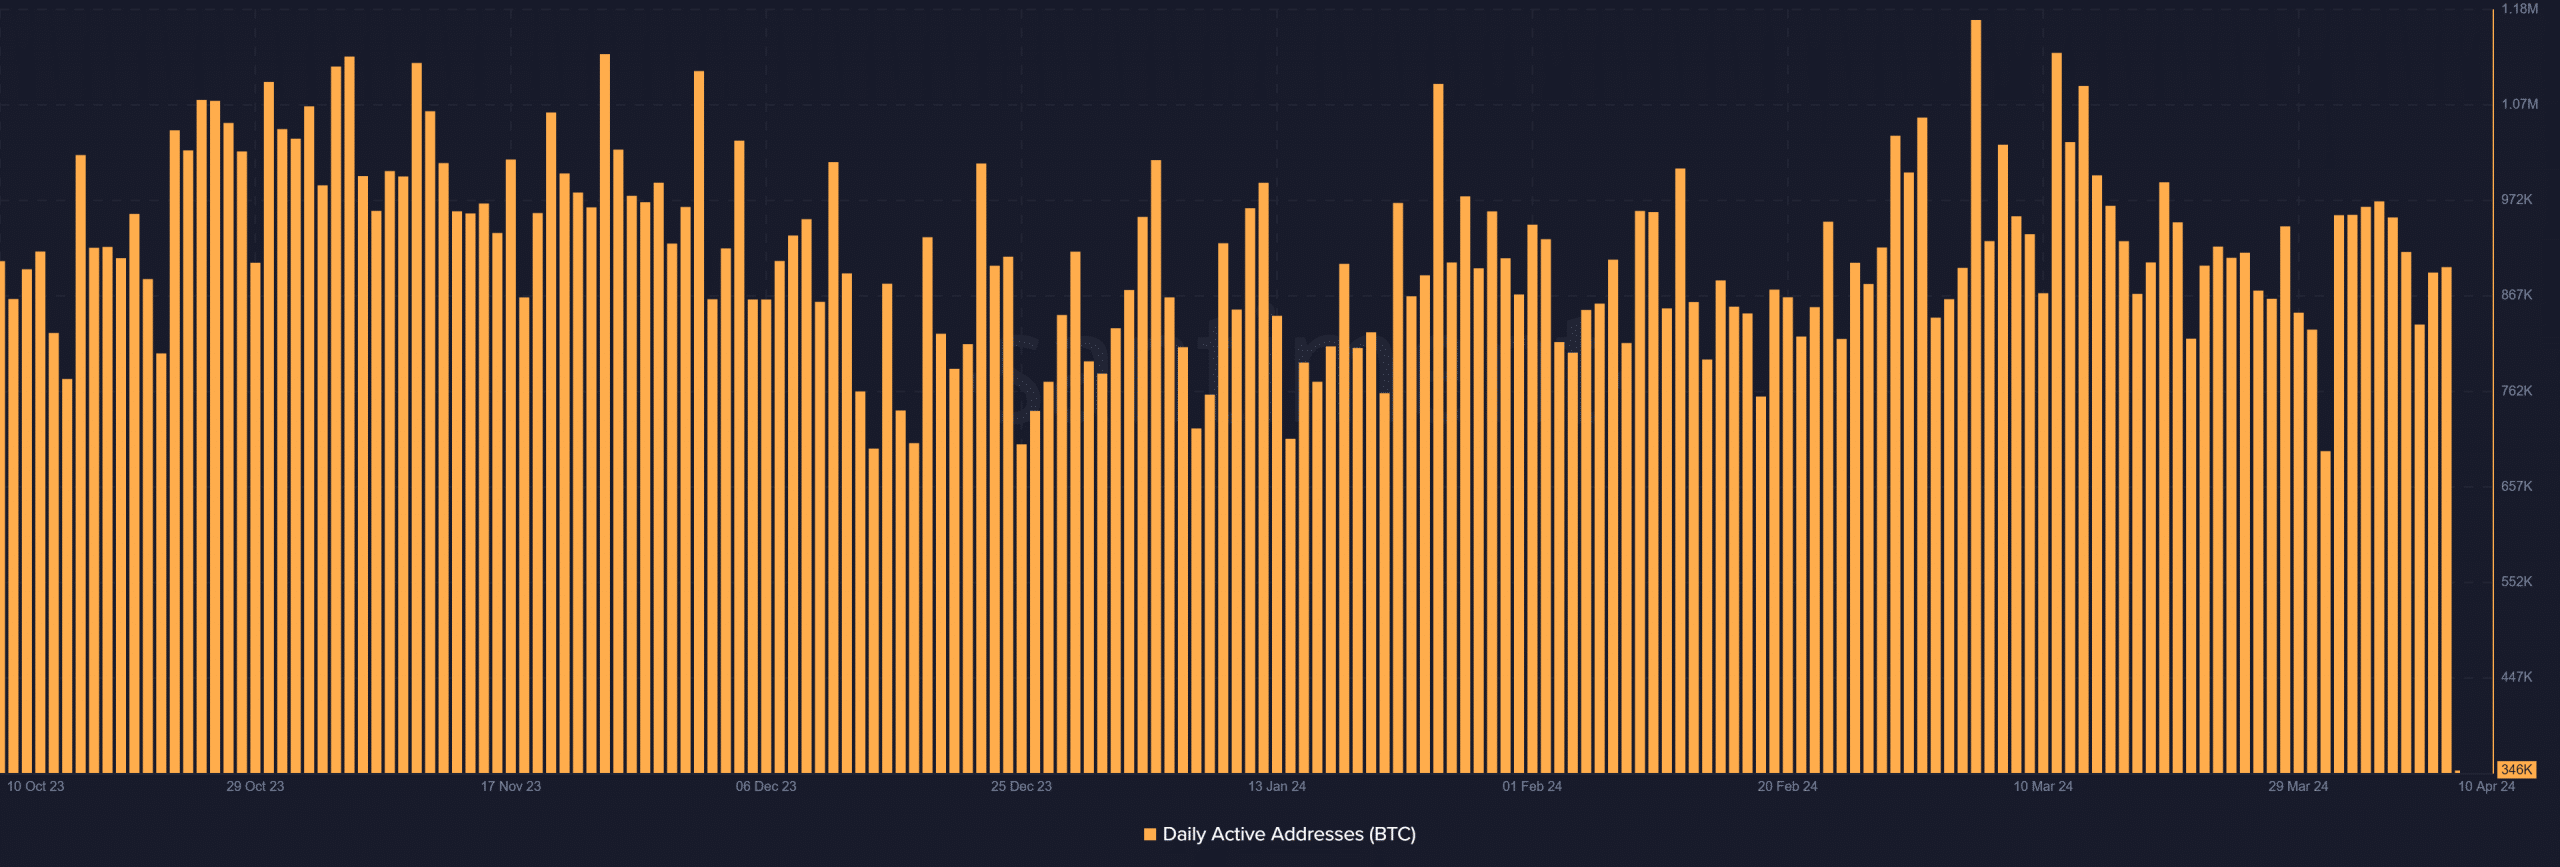
An analysis of Bitcoin's daily active addresses also showed a slight increase in the last four days, with this value hovering around the 800,000 threshold. Between April 7th and 8th, active addresses increased from around 835,000 to over 892,000, with a further increase to over 898,000 by April 9th.

Source: Santiment
On the contrary, the 7-day active addresses chart highlights a recent decline. From April 7th to April 10th, active addresses fell from over 4.9 million to around 4.7 million. These metrics suggest that while there are a significant number of active wallets, many participants may be taking a wait-and-see approach.
– Read Bitcoin (BTC) Price Prediction 2024-25
At press time, Bitcoin’s open interest had also fallen. Data from Coinglass showed that open interest was around $36.89 billion, compared to $37.84 billion on April 9. What can be derived here? Well, even though the numbers are falling, there is still a significant amount of capital flowing into the market. Here too, the short-term price development of Bitcoin is unlikely to have any influence.
Learn Crypto Trading, Yield Farms, Income strategies and more at CrytoAnswers
https://nov.link/cryptoanswers