
Bitcoin (BTC) could make significant gains from here, says analyst Benjamin Cowen — but there’s a catch


A popular crypto analyst uses a specific metric to show where Bitcoin (BTC) might be headed on price charts.
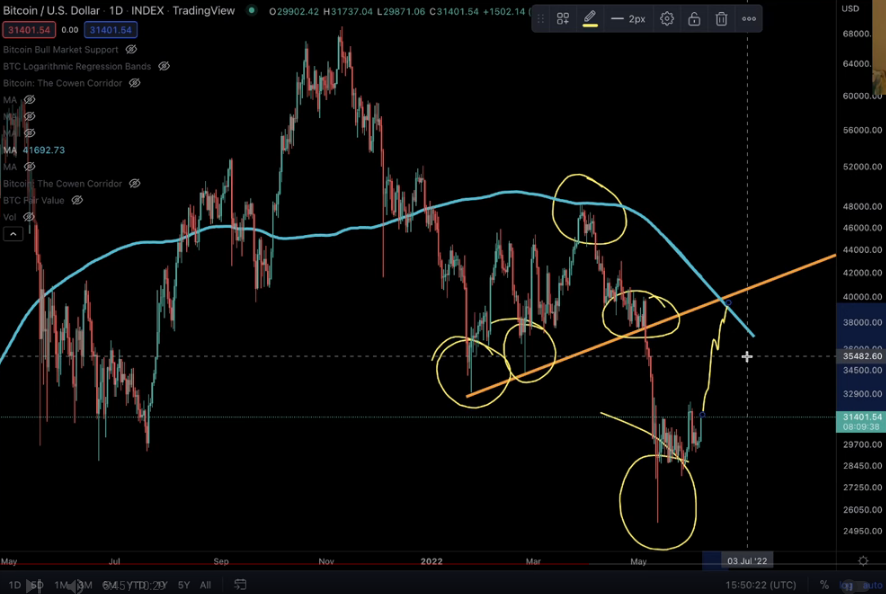
In a new strategy session, Benjamin Cowen explains to his 748,000 YouTube subscribers that the 200-day simple moving average (SMA) is an accurate indicator of future BTC prices, citing chart data from 2018 as a previous example.
“Everyone has a plan until it is rejected by the 200-day moving average.
We had a failure to post a higher low following the rejection of the 200-day moving average. What came next? A deeper low, same thing that happened here in 2018.
What has happened in the past after you make your first lower low is that you get a recovery rally back to the 200-day moving average or back to the uptrend line, which we previously held as support.”
Credit: Benjamin Cowen/YouTube
Next, Cowen points to two potential price points on the SMA, namely $41,700 and $40,000, which he believes are crucial levels for BTC to hold.
“Today, the 200-day SMA is around $41,700, but it is moving down relatively quickly. If we were to extrapolate this dubiously… You can see that the 200-day moving average could be close to $40,000 by mid-June.
If we restart a recovery rally, you’ll want to look at that 200-day moving average because that’s a line in the sand that we need to break again.”
The analyst concludes his remarks by saying that Bitcoin may take multiple attempts to break out of the 200-day SMA price point, and since BTC is currently in a bear market, it’s difficult to pinpoint exactly how and when the largest crypto asset by market cap will rally again.
“One thing to remember, in 2018 we might have seen sustained rejection by the 200-day SMA twice, but a third time you could argue… maybe not really, but we almost made it, and then we finally got over it with the fourth real try.
Maybe there will be another one in the next few weeks. If that’s the case, then prepare for the 200 days. I said that back in March, said we are in a bear market, don’t assume we will just break above the bull market support band and hold it at support just because we did it last time.
The 200-day price, which held as resistance a few months ago, could come as resistance again. We don’t say it has to.”
The bull market support band is a technical indicator that combines BTC’s 20-week SMA and the 21-week exponential moving average (EMA).
 Credit: Benjamin Cowen/YouTube
At the time of writing, Bitcoin has recouped losses after a sudden drop on June 6th sent it below $30,000.
BTC is currently trading at $31,366.
I
Check the price action
Don’t miss a thing – Sign up to receive crypto email alerts straight to your inbox
Follow us on Twitter, Facebook and Telegram
Surf the Daily Hodl Mix
 
Check the latest headlines

Disclaimer: Opinions expressed on The Daily Hodl are not investment advice. Investors should do their due diligence before making any risky investments in bitcoin, cryptocurrency or digital assets. Please note that you transfer and trade at your own risk and any losses you incur are your responsibility. The Daily Hodl does not recommend the purchase or sale of cryptocurrencies or digital assets, nor is The Daily Hodl an investment advisor. Please note that The Daily Hodl participates in affiliate marketing.
Featured image: Shutterstock/Natalia Siiatovskaia/Joy Chakma
Learn Crypto Trading, Yield Farms, Income strategies and more at CrytoAnswers
https://nov.link/cryptoanswers
Comments are closed.