


The bears continue their push as most coins remain in the red.
BTC/USD
Bitcoin (BTC) price is down 0.29% since yesterday while the price is up 1.46% over the last week.
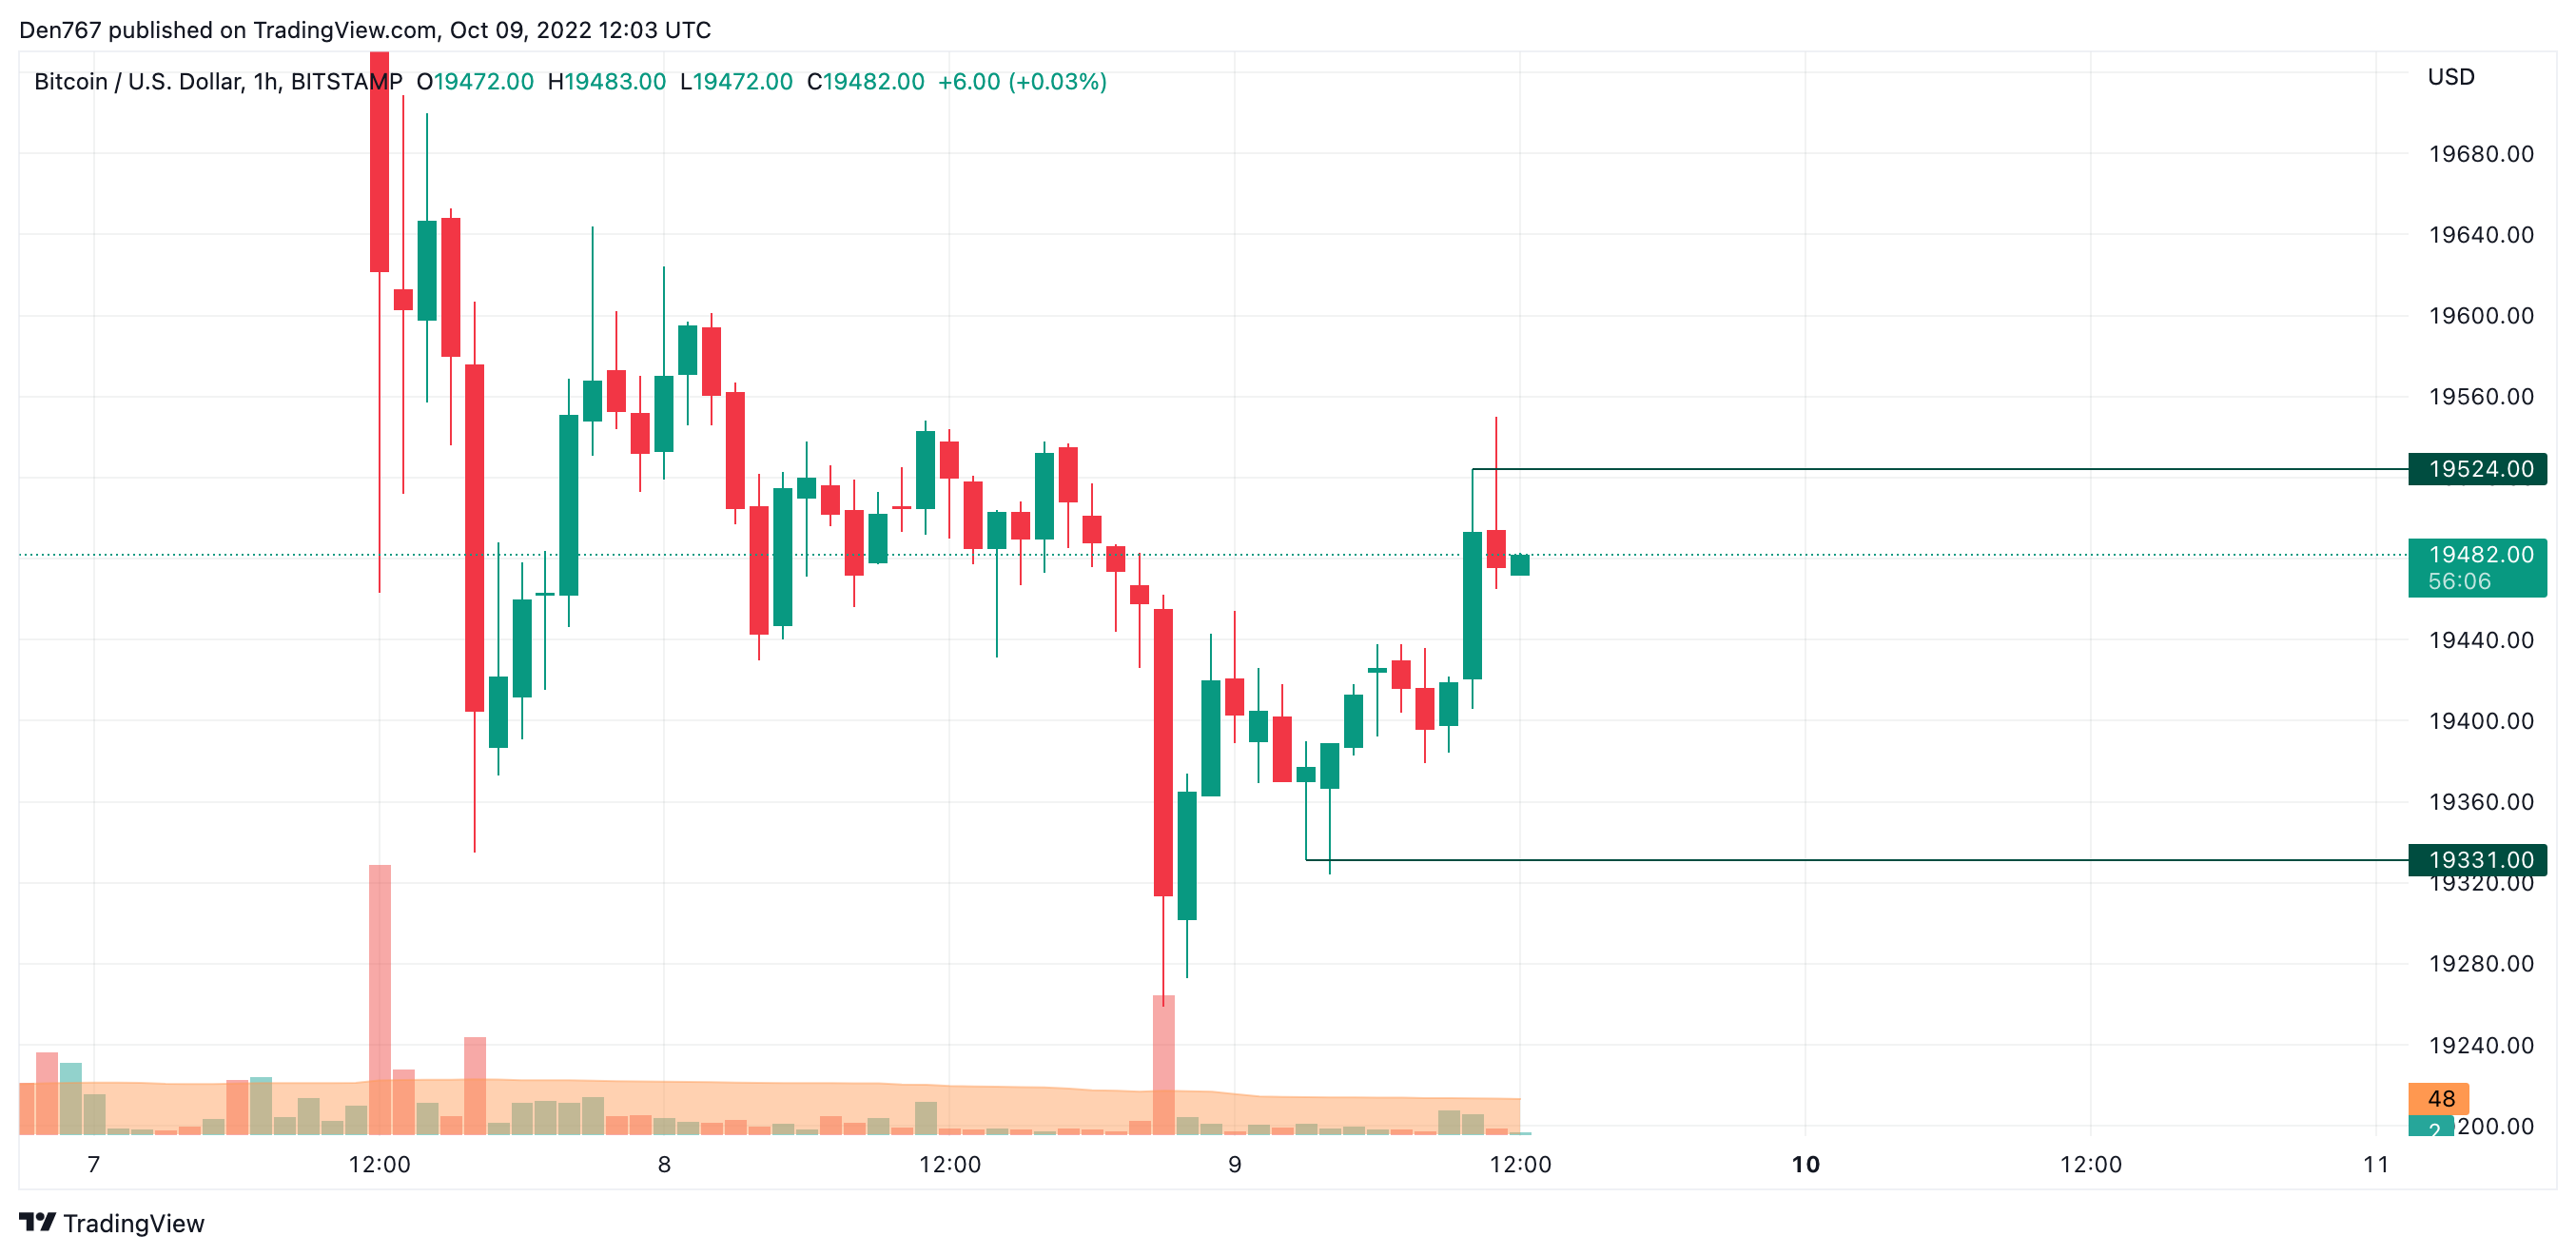
On the hourly chart, Bitcoin (BTC) has started to rally after the false breakout above the $19,331 support level. Right now, the price is near the local resistance at $19,524.
If the buyers can hold the gained initiative, the climb could continue to the $19,600 zone.
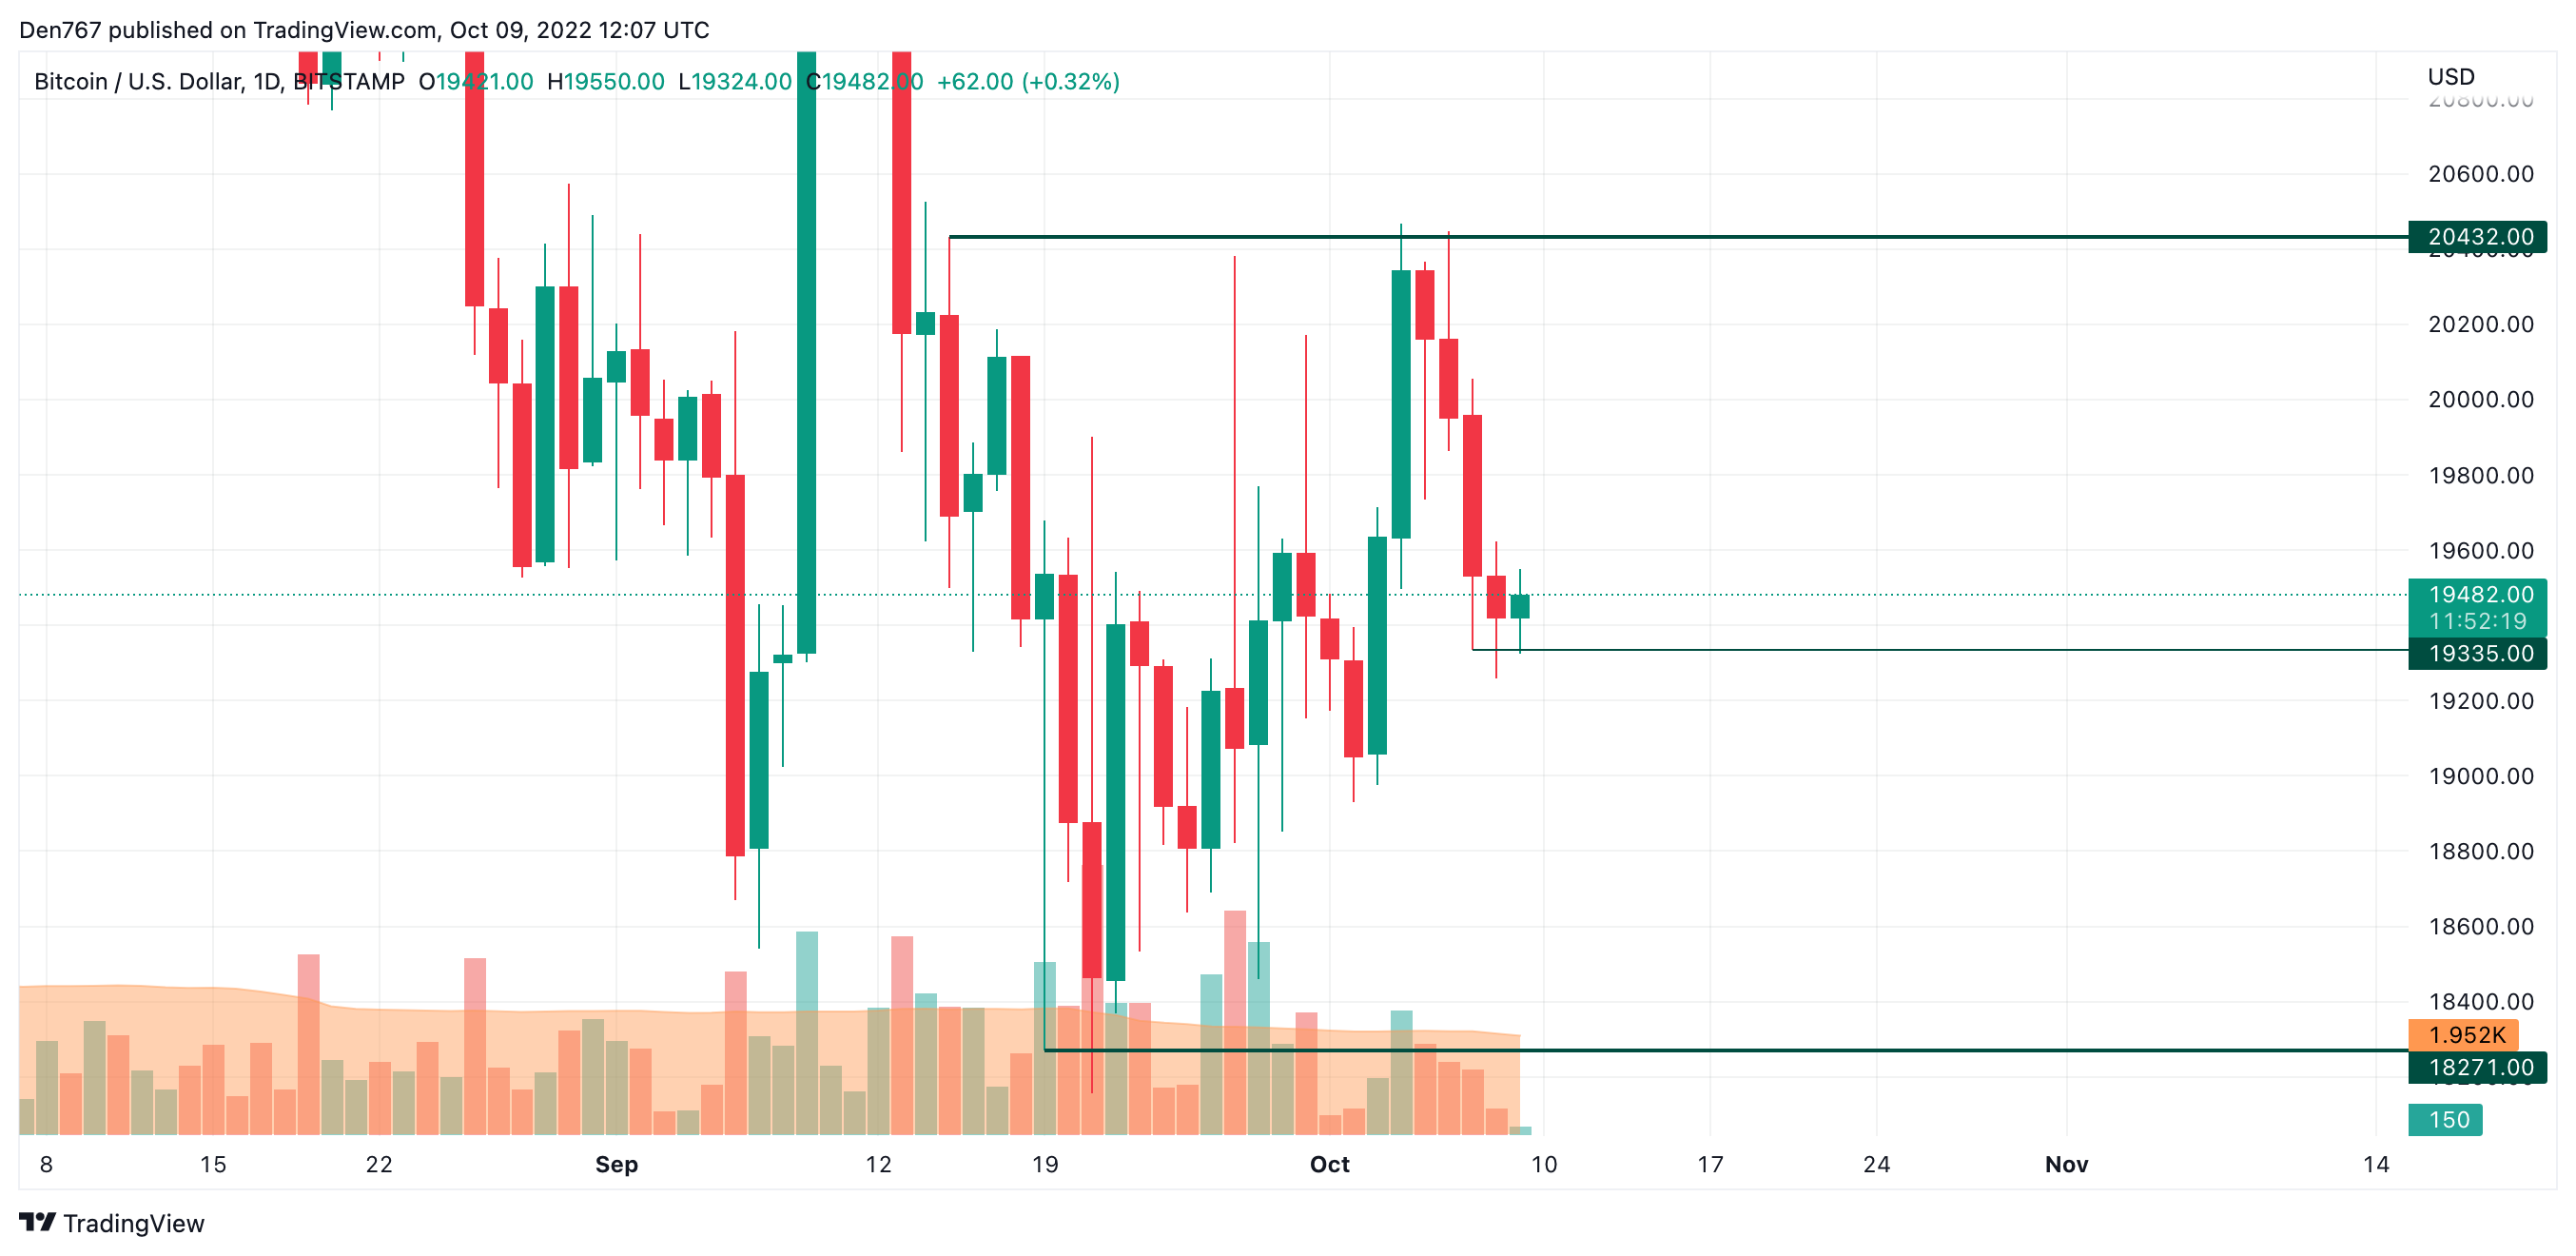
On the larger time frame, Bitcoin (BTC) has bounced off the $19,335 support level again. While the price is above that, there is an opportunity for local growth. In this case, the next zone for sellers to return to the game is the $19,800 area.
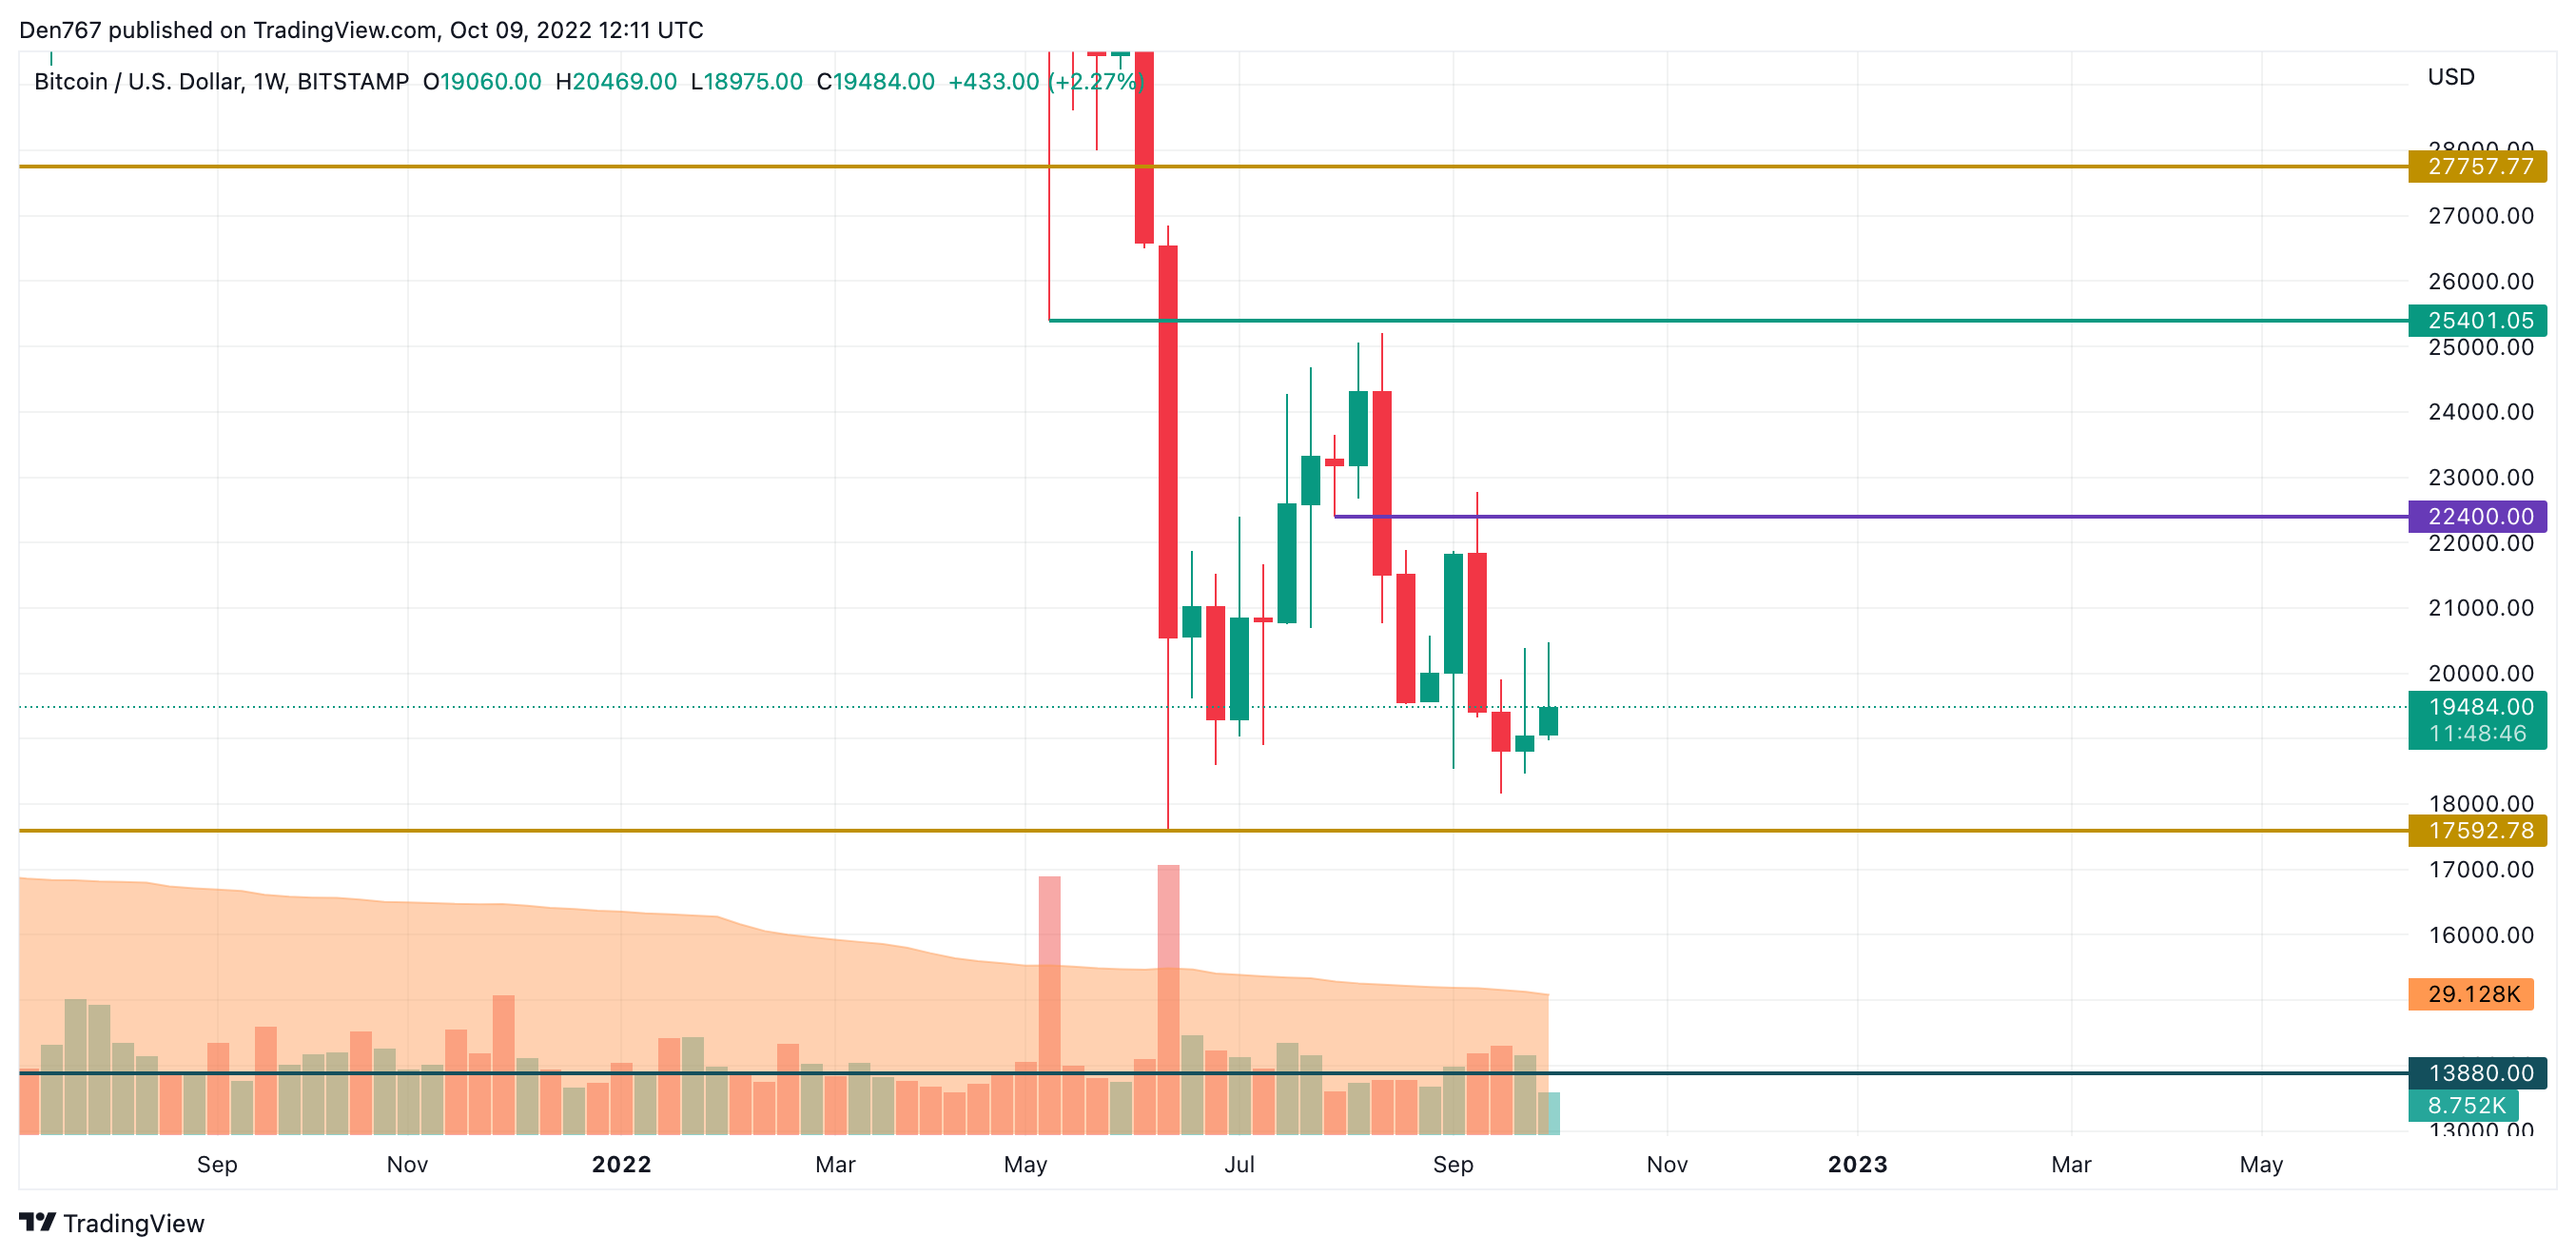
From a medium-term perspective, the situation is bearish rather than bullish as the price is still close to the $17,592 support level. If buyers lose the $19,000 mark, a sharp slump is to be expected soon.
Bitcoin is trading at $19,503 at press time.
Learn Crypto Trading, Yield Farms, Income strategies and more at CrytoAnswers
https://nov.link/cryptoanswers
Comments are closed.