


Bitcoin (BTC) price has surged in 2023 but is showing signs that the upside is running out of steam. A short-term correction could occur in the next few weeks.
Bitcoin price has been rising since Nov. 21 when it traded at a yearly low of $15,476. Shortly thereafter, it produced a higher low. It then broke out of a descending resistance line on January 13th. At the time of the outbreak, the line had been in effect for nearly six months. Breakouts from such long-term structures often result in significant upside moves.
So far, BTC price has peaked at $23,954. However, there are first signs of weakness. These are visible in both the daily RSI and candlestick patterns.
First, the daily RSI has created bearish divergence. The fact that the divergence appears in the overbought territory increases its importance. If the RSI breaks below 70, it would confirm that a decline is to follow.
Additionally, a bearish engulfing candlestick could form depending on the daily close. A close below $23,030 will confirm this.
Based on these reads, a drop towards the $21,000 support area is the most likely scenario. On the other hand, a daily close above $24,500 would invalidate this bearish prospect and suggest that the price of the digital asset will rally towards $30,000 instead.
BTC/USD daily chart. Source: TradingView
Bitcoin Price Wave Count predicts a correction
A closer look at the wave number supports the possibility of a decrease. It shows that bitcoin price is either at the end of wave three or has already started wave four of a five-wave up move. Wave three has lengthened significantly but has lost momentum over the past 24 hours.
Since wave four is usually flat, the most likely outlook suggests that it will only correct to the 0.382 Fib retracement support level near $21,000, aligning with the $21,000 horizontal support area outlined earlier.
After that, the upward move could continue to $26,080 or even $27,830. The targets are found by expansions 3.61 and 4.21 of the first wave. However, a more precise target can be estimated once wave four is complete.
On the other hand, a drop below the first wave high of $18,040 (red line) will invalidate this count as it would mean that the fourth wave would have fallen into the territory of the first wave. In that case, lows near $15,000 are expected.
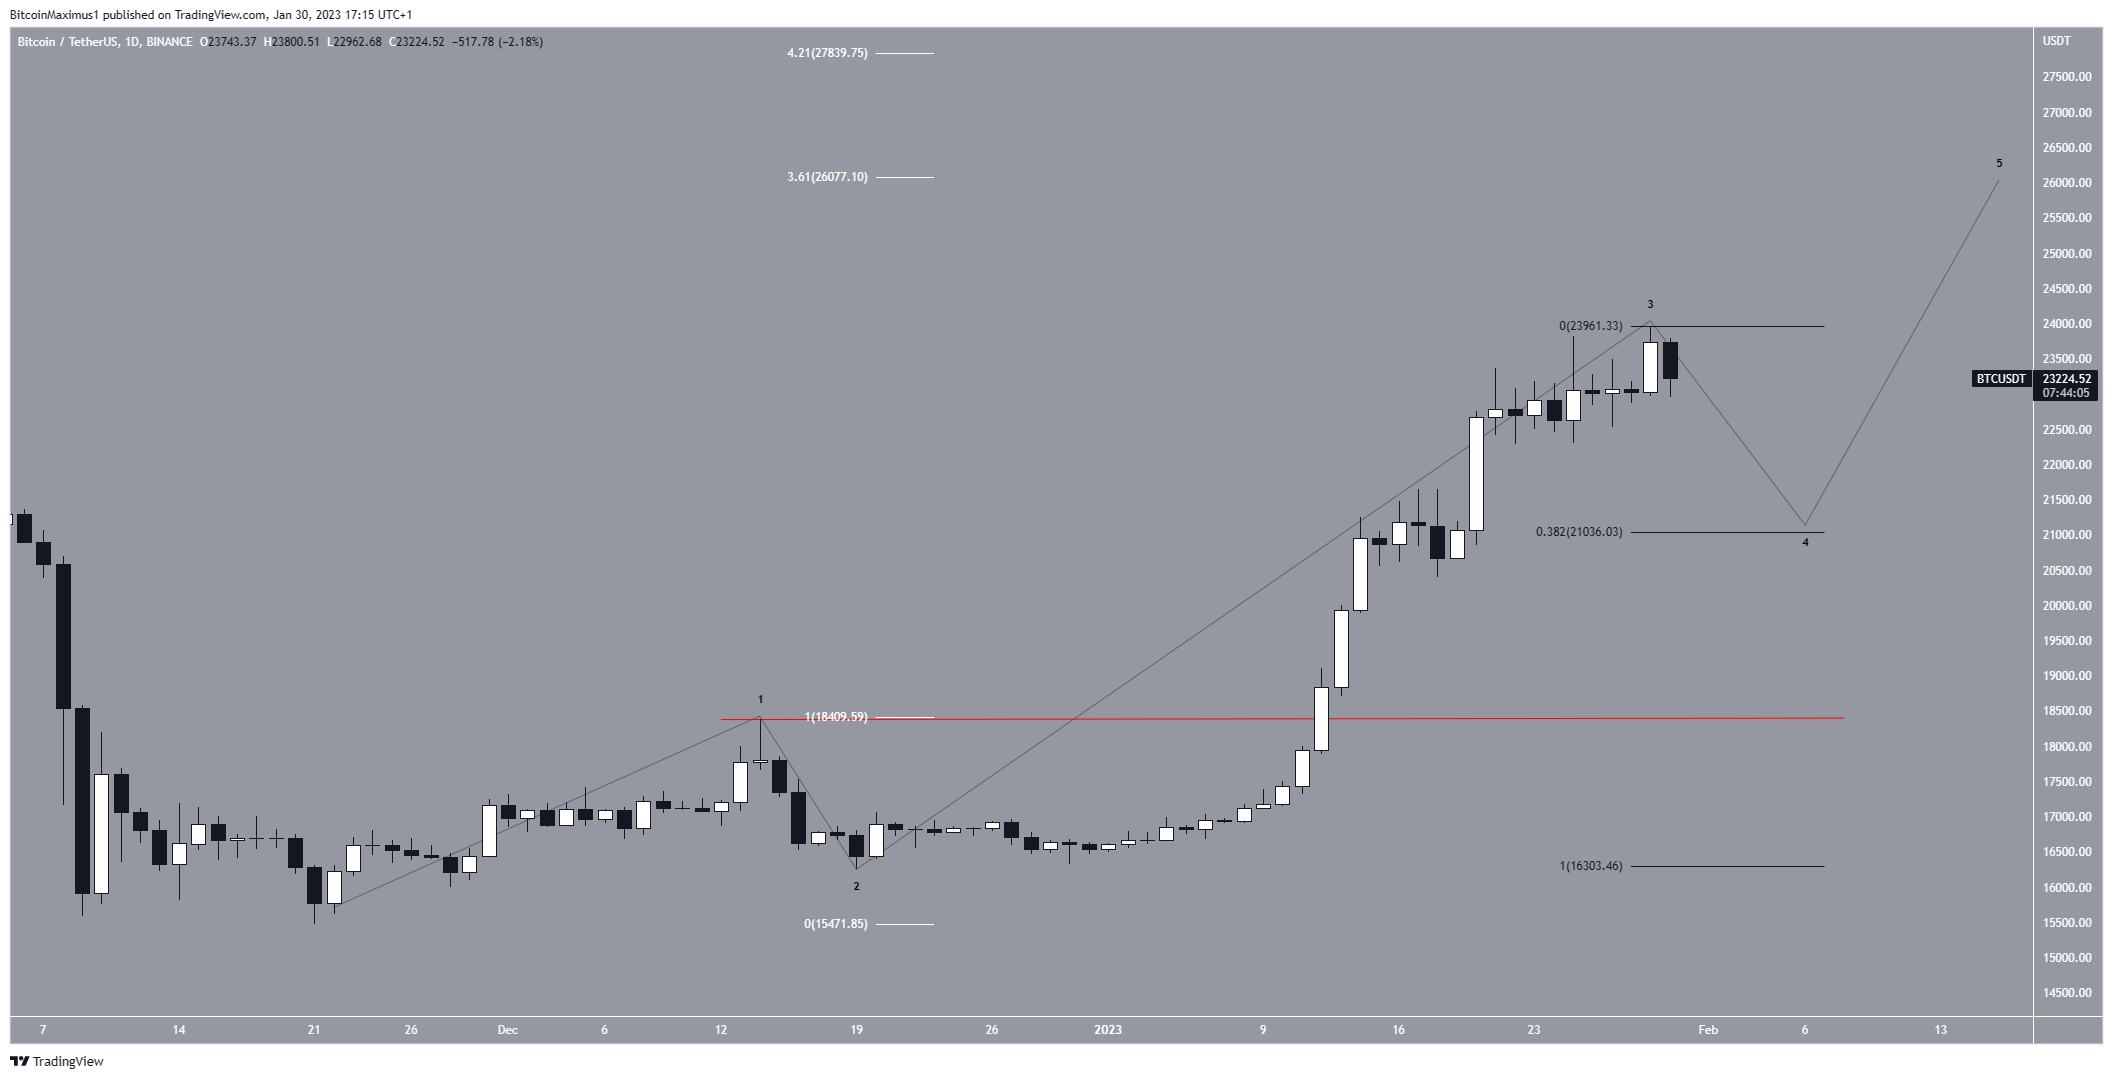 BTC/USDT daily chart. Source: TradingView
To sum up, the most likely bitcoin price prediction is a short-term decline towards $21,040 followed by an upward move towards $26,000 and possibly $27,830. A drop below $18,400 would invalidate this bullish outlook. In this case, bitcoin price would likely make lows near $15,000.
For BeInCrypto’s latest crypto market analysis, click here.
Disclaimer
BeInCrypto strives to provide accurate and up-to-date information, but accepts no responsibility for missing facts or inaccurate information. You agree and understand that you should use this information at your own risk. Cryptocurrencies are highly volatile financial assets, so do your research and make your own financial decisions.
Learn Crypto Trading, Yield Farms, Income strategies and more at CrytoAnswers
https://nov.link/cryptoanswers
Comments are closed.