


Bitcoin Price Prediction: Technical analysis by Julius de Kempenaer, Senior Technical Analyst at StockCharts.com, signals downside risk for Bitcoin (BTC). That’s how it works.
free market
Bitcoin, or rather the entire cryptocurrency market, is the perfect example of a “free market” ruled by supply and demand. Access to the market is easy and information is widely available. As a result, human emotions such as “fear and greed” are unrestricted. All in all, this combination of factors makes cryptocurrencies well suited for the use of technical analysis.
Fundamental analysis looks at external factors that can affect price. On the stock market, analysts look at sales (growth), sales prices, cost of goods, etc. Based on all of this information, they arrive at a “fair value” for the company. If the company’s shares are trading below what the fundamental analyst thinks is fair, it would be interesting to buy that stock.
Of course, if the stock price is above that fair value, it would be better to sell.
In the crypto market, factors such as the number of new coins mined, the amount of coins freely traded, the background of a particular project related to a cryptocurrency, etc. are used by fundamental analysts to determine a coin’s intrinsic value and decide whether it is the case is buy or sell.
Technical analysis takes a different approach. A technical analyst ONLY looks at the price. At the end of the day, the price at which an investor buys and sells makes the difference between profit and loss. And the prices are determined by the buying and selling activity of investors in the market.
Fear and greed drive herd behavior
Investors are clearly influenced by many (external) factors, with news being the most important. Any time news is released on a market or security, investors will check the price of the associated or related security.
Over the years, crypto had made the news many times. At times it was incredibly positive, sending prices skyrocketing and creating a group sentiment known as FOMO. Fear of missing out – “Everybody makes money from crypto and I don’t, I have to participate.” And on the other hand there were also stories about regulation or about countries banning crypto mining and trading. This had a negative impact on prices.
These events clearly generate a lot of emotion and drive investors’ buy and sell decisions.
Since herd behavior is not alien to human nature, all of this buying and selling will create “trends” that show up on charts. And this is where technical analysis comes in.
Bitcoin Price Prediction: Technical Analysis and Charts
Technical analysts use charts to find price trends and try to gauge whether that trend is likely to continue or possibly reverse. Our toolbox on Stockcharts.com is filled with a variety of metrics derived from price. But we also use more subjective interpretations of specific trends and patterns as they form on charts. This is based on extensive historical studies showing that markets tend to react similarly in certain situations.
Charts help show trends in supply and demand
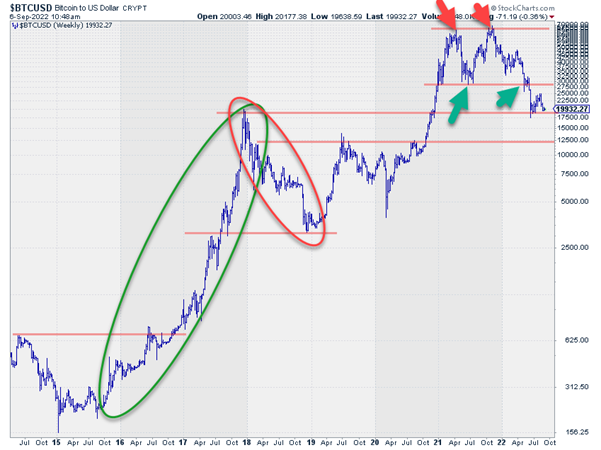
When analyzing price trends, the highs and lows visible on a chart contain crucial information. They tend to serve as “support” or “resistance” levels after they form, and markets revert to these old levels.
Translate “support” with “demand” and “resistance” with “supply” and reading a chart suddenly becomes a lot easier and makes more sense. In the BTC chart above, I highlighted a major uptrend that started in late 2015 and ended in late 2017. And a downtrend that started in late 2017 and ended in late 2018.
Technicians define an uptrend as a series of “higher highs” and “higher lows.” A DOWNtrend is the opposite, a series of lower highs and lower lows. The two highlighted examples are each a good example.
Further to the right of the chart we have some good examples of old highs and lows that act as support (always below the current market price) or resistance (always above the current market price). It never ceases to amaze me how those old tops and bottoms seem to act like magnets.
Bitcoin price prediction
In March-April 2021, the price of BTC peaked in the 65,000 range before falling back to just under $30,000. The rally off the July 21st low brought BTC back up and by the end of the year it was back to that 65,000 area (see red arrows).
At around $65,000 sellers (=supply) dominated the market and demand just wasn’t strong enough to push BTC above $65,000. This additional supply in the $65,000 area created a lot of resistance and caused a new top at the same level. Sellers then started pushing BTC back down until it touched areas of its previous low, just under $30,000.
A small hesitation is visible as the old low started to act as support and attract buyers. But that didn’t last long as BTC fell below its support level of around $30,000 in June of this year.
Bitcoin price prediction: step on the brakes
Breaking through a support level very often, also in this case, leads to an acceleration of the movement. Within 3-4 weeks, BTC fell back to the level of the late 2017 peak around $20,000 and a new low formed at that level.
When buyers are not strong enough to keep the price at or above its support level, it is a sign of weakness. It indicates that sellers (supply) are still in control. After a brief rally, BTC is now back in the $20,000 area and is hovering around this level.
Price behavior in the coming weeks will be crucial for BTC’s near-term development. The dominant trend is down. A clear rhythm of lower highs and lower lows is visible from the top to bottom of November 21st. This means that the upside potential for BTC is now limited as each previous high will attract new selling activity, making it difficult for BTC to push higher.
About the author

Julius de Kempenaer is Senior Technical Analyst at StockCharts.com, a financial charting platform for online retail investors.
Do you have something to say about this bitcoin price prediction or something else? Write to us or join the discussion on our Telegram channel. You can also reach us on Tik Tok, Facebook or Twitter.
Disclaimer
All information contained on our website is published to the best of our knowledge and for general information purposes only. Any actions taken by the reader based on the information contained on our website are entirely at your own risk.
Learn Crypto Trading, Yield Farms, Income strategies and more at CrytoAnswers
https://nov.link/cryptoanswers
Comments are closed.