
Bitcoin price analysis: BTC is struggling to break the 50MA $17.9k and 100MA $18.7k resistance levels


Bitcoin price analysis shows that BTC is still struggling to break two key resistance levels: the 50-day moving average at $17.9k and the 100-day moving average at $18.7k. Bitcoin is exchanging hands at $17,172.43, a level it has held at for the past few days.
Cryptocurrency price heatmap: Coin360
The next level of resistance stands at $17,300, followed by $17,500. The 20-day and 50-day moving averages are also around this level, adding further resistance to any upside move. If the bulls manage to clear these resistance levels and close above $17,500, it could result in a mini-rally for BTC that could last for a few days. However, given Bitcoin’s extremely low trading volume and momentum of late, it’s difficult to predict the outcome of such a move given the current low volatility.
On the downside, support was found at the $16,800 level. If the price breaks below this support, more downward pressure could be felt in Bitcoin and the rest of the cryptocurrency market.
BTC/USD 1-Day Technical Analysis: Bears still in control
Bitcoin price analysis shows a bearish trend in the last 24 hours. BTC has moved sideways within a range between $17,202.09 and $17,120.68. The bears have dominated most of today’s trading sessions as BTC continues to face significant resistance at the 50-day moving average level. The RSI is currently in the neutral territory, which suggests that the bulls may regain control shortly. However, the overall picture shows that Bitcoin is still stuck in a bearish trend and could fall further if it does not close above $17,500 soon.
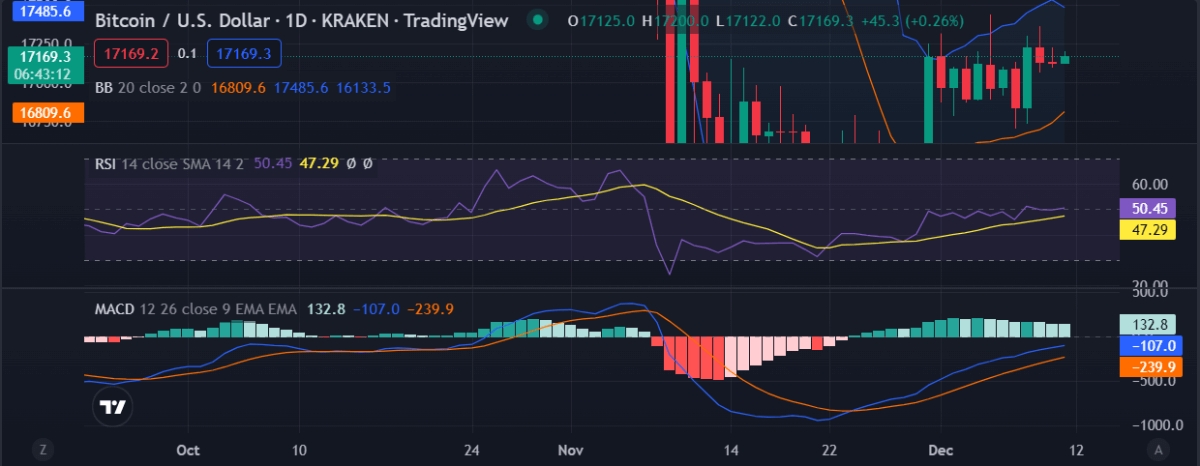 BTC/USD 24 hour chart. Source: TradingView
A Fibonacci retracement is a technical tool used to measure the size of a potential pullback in an asset. Bitcoin’s recent pullback from $18,000 has been relatively minor, and the Fibonacci retracement tool shows that Bitcoin is still far from completing its correction phase. However, the $17,000 level appears to be the bottom of this correction. A break below this level could result in a bearish move as the 50-day moving average has also turned into resistance at $17,400.
Based on the technical chart, it appears that Bitcoin is still stuck in a tight range between $17,000 and $17,300. While the short-term outlook suggests BTC has a chance to revisit above $17,500, the longer-term trend suggests bears are in control.
Bitcoin price analysis on a 4 hour chart: $17,500 is the main resistance
On a 4-hour timeframe, bitcoin price is still trading below the moving averages and is facing strong resistance at $17,500. The RSI indicator is slightly above 50, suggesting that there could be more upside potential for BTC in the near-term. However, it appears that Bitcoin will face some selling pressure once it hits $17,500. The MACD indicator is also pointing to potential downside for BTC as the trend remains bearish on this timeframe.
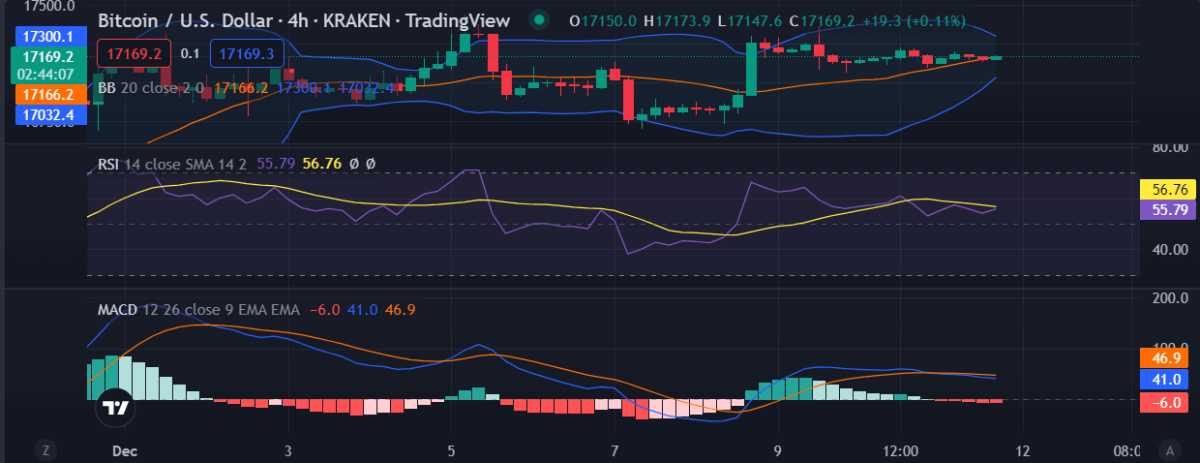 BTC/USD 4 hour chart. Source: TradingView
Bitcoin price analysis conclusion
Bitcoin price analysis shows that BTC is still stuck in a bearish trend despite finding support at the $17,000 level. Barring a major bullish breakout above $17,500 soon, Bitcoin could continue falling in the coming days.
While you wait for bitcoin to keep moving, check out our price predictions for XDC, Cardano, and Curve.
Learn Crypto Trading, Yield Farms, Income strategies and more at CrytoAnswers
https://nov.link/cryptoanswers
Comments are closed.