


Bitcoin price experienced another sell-off yesterday, falling more than 5% intraday to as low as $40,660. Since the year-to-date high of $49,000 on January 11, BTC price has fallen by as much as 17%. However, according to renowned crypto analyst Jacob Canfield, this may not be the end of the correction. In a recent analysis, Canfield warned that further downside risks could be expected in the near term.
The analyst, known for accurately predicting Bitcoin's local peak, addressed the prevailing uncertainty in the market. “The question on everyone's mind now is 'Where do we go from here?'” the analyst asked, acknowledging the community's growing concerns.
A key factor in the current market dynamics is the approval of a Bitcoin ETF, which has led to speculation that Grayscale Bitcoin Trust (GBTC) investors are selling their holdings to avoid associated fees. The story is compounded by revelations from court filings that FTX's bankruptcy estate holds a significant number of GBTC shares, approximately 22,280,720 (worth $744 million), available for liquidation.
Conversely, there are signs of market optimism as BlackRock's ETF, IBIT, is reportedly accumulating spot Bitcoin aggressively, totaling 25,067 Bitcoins in less than a week. The analyst suspects that this buying momentum from BlackRock could ultimately offset GBTC's selling pressure, especially considering the impact of Bitcoin's upcoming halving, which could result in a “delayed impact” event that could potentially lead to demand exceeds the offer.
How low can Bitcoin price fall?
Chart analysis offers a more immediate and bleak perspective. Bitcoin's 4-hour chart indicates a losing trend that is now acting as resistance, which is historically an ominous sign for short- to medium-term price action.
“Bitcoin’s 4-hour trend has been lost and tested as resistance. This is not great as the 4-hour trend has historically been a good indicator of short and medium-term price movements, the analyst noted.
Canfield further points out, “If I were looking for a level for a short-term upswing, it would probably be at a liquidity average of $40,000,” indicating possible downward pressure on the price.
The Bitcoin daily chart shows a narrow path with significant levels at $48.7K marked by the 61.8% Fibonacci retracement and weekly resistance, and a notable support level at $38.7K. “As I have noted in previous posts, after BTC hits 61.8, it is trending towards an 18-22% sell-off, which would also give us another break at that $38.7k level,” warns Canfield.
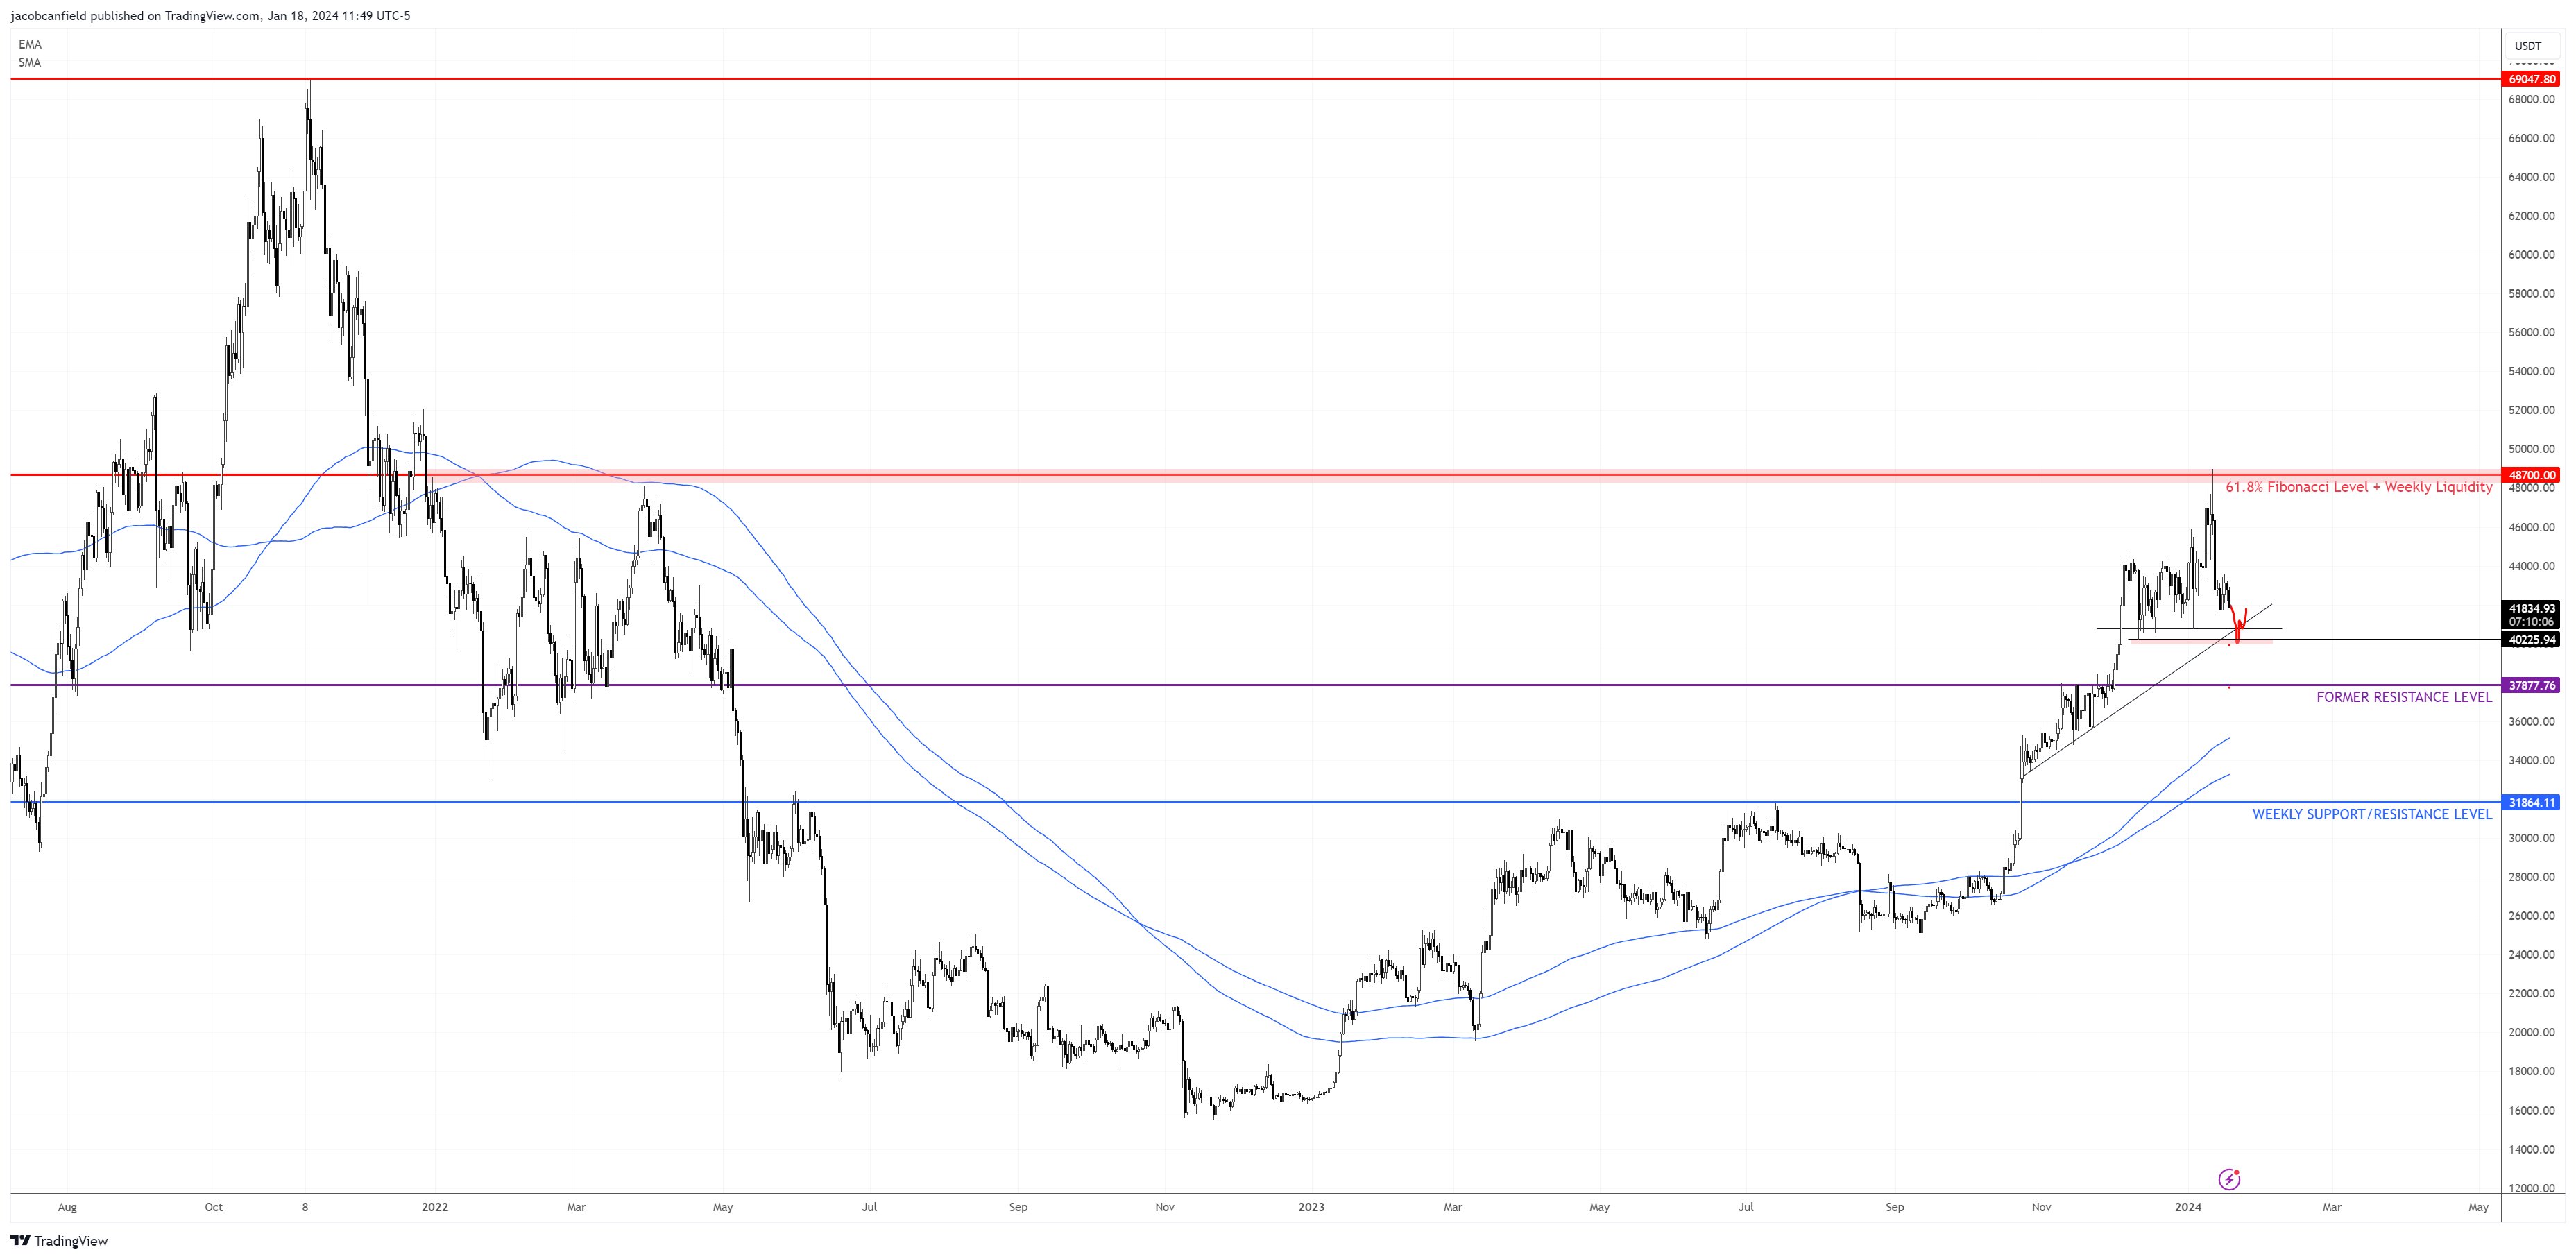 Bitcoin price analysis | Source: X @JacobCanfield
Additionally, the daily 200s (EMA/MA) are currently trending higher as they previously acted as support, suggesting that they could cushion further price declines.
The analyst concludes with a word of caution, emphasizing the need for vigilance in the current market characterized by low volume and low volatility, conditions that often precede significant market movements: “The most important thing I can emphasize is that at low Caution is advised in volume and low volatility environments as a big move usually follows.”
At press time, BTC was trading at $41,178.
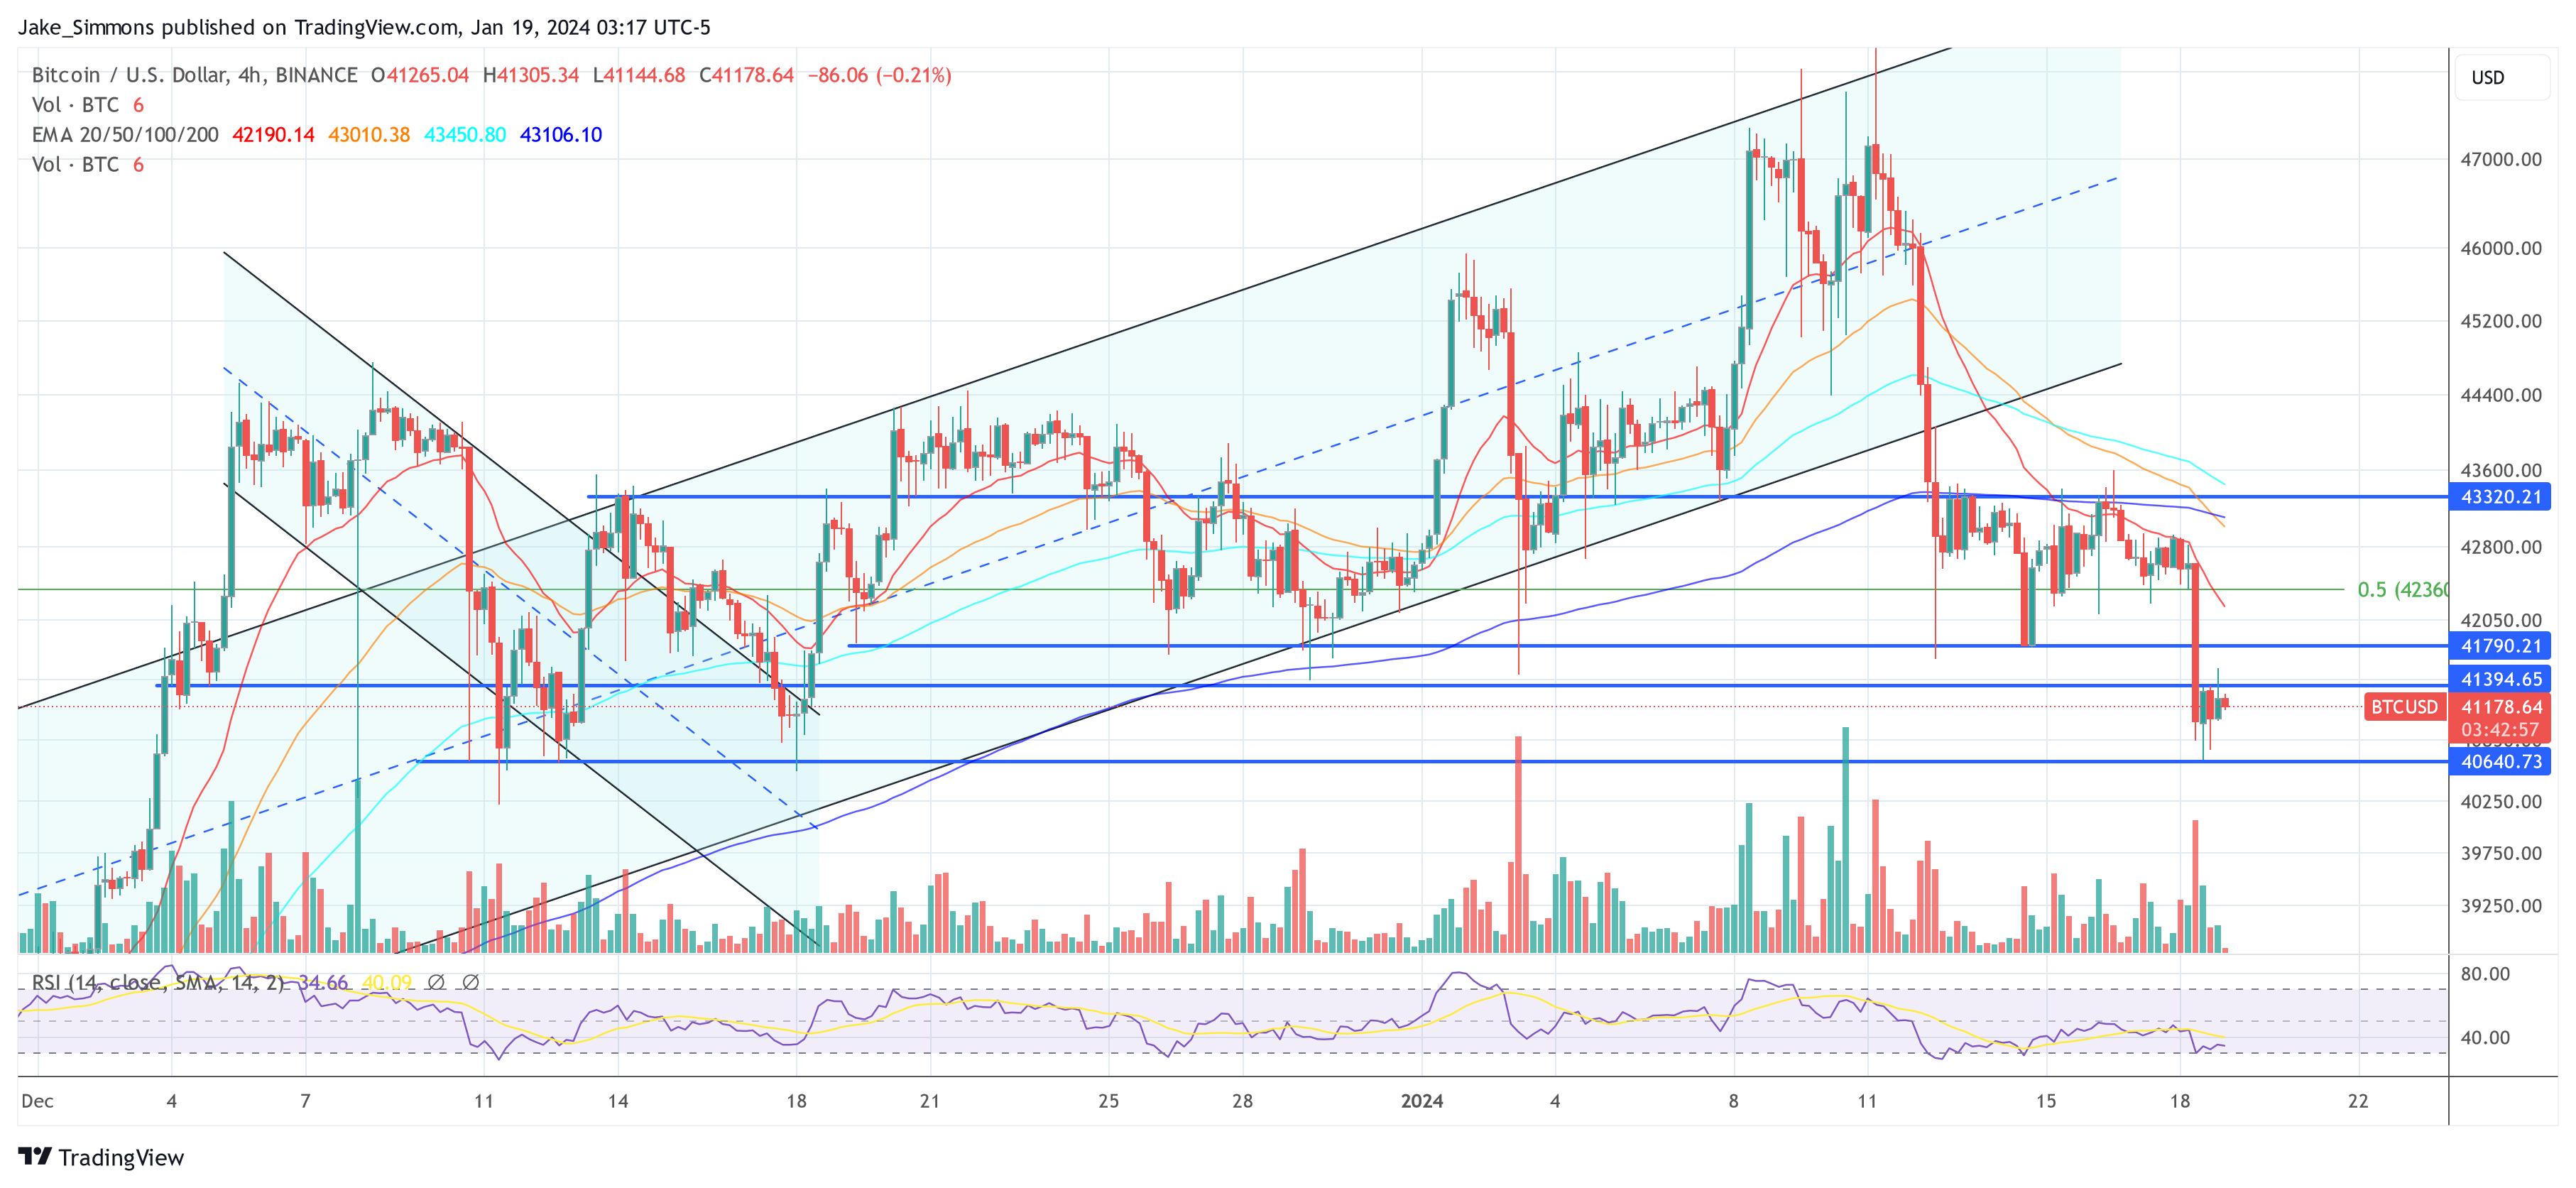 BTC price, 4-hour chart | Source: BTCUSD on TradingView.com

Featured image created with DALL·E, chart from TradingView.com
Learn Crypto Trading, Yield Farms, Income strategies and more at CrytoAnswers
https://nov.link/cryptoanswers
Comments are closed.