


Bitcoin price continues to face strong resistance around $19,400. In the last 24 hours, the coin lost 2.9% in value. Earlier this month, bitcoin price had briefly recovered but was met with selling pressure.
After the coin started moving near the $18,000 price mark, this level attracted buyers on the chart. Shortly after, BTC surged higher on its chart two weeks ago. The coin’s technical outlook suggested that the bears had not given up just yet.
The bulls could return to the chart if the coin breaks its immediate resistance level. Buying power was lower on the chart and only an increase in buying power could move BTC higher.
If the bulls manage to weather the next trading sessions, BTC can surge above the $20,000 price level. The chance of a rally near $22,000 also cannot be called impossible once the bulls scale above $20,000.
Bitcoin Price Analysis: One-Day Chart
Bitcoin was valued at $19,190 on the one-day chart | Source: BTCUSD on TradingView
BTC was trading at $19,190 at the time of writing. The coin had faced significant resistance at the $19,400 price level. Crossing this level will help the coin gain momentum to approach the $21,000 resistance level.
Once bitcoin price touches $20,000, bulls could help BTC stage another rally. On the other hand, support for BTC was at $18,000 and a drop from that would push the coin to $17,400. If the buyers do not reappear in the next few trading sessions, a drop to the $18,000 price zone is likely.
Over the past few trading sessions, the amount of bitcoin traded has declined, indicating a slowdown in buying pressure.
Technical Analysis
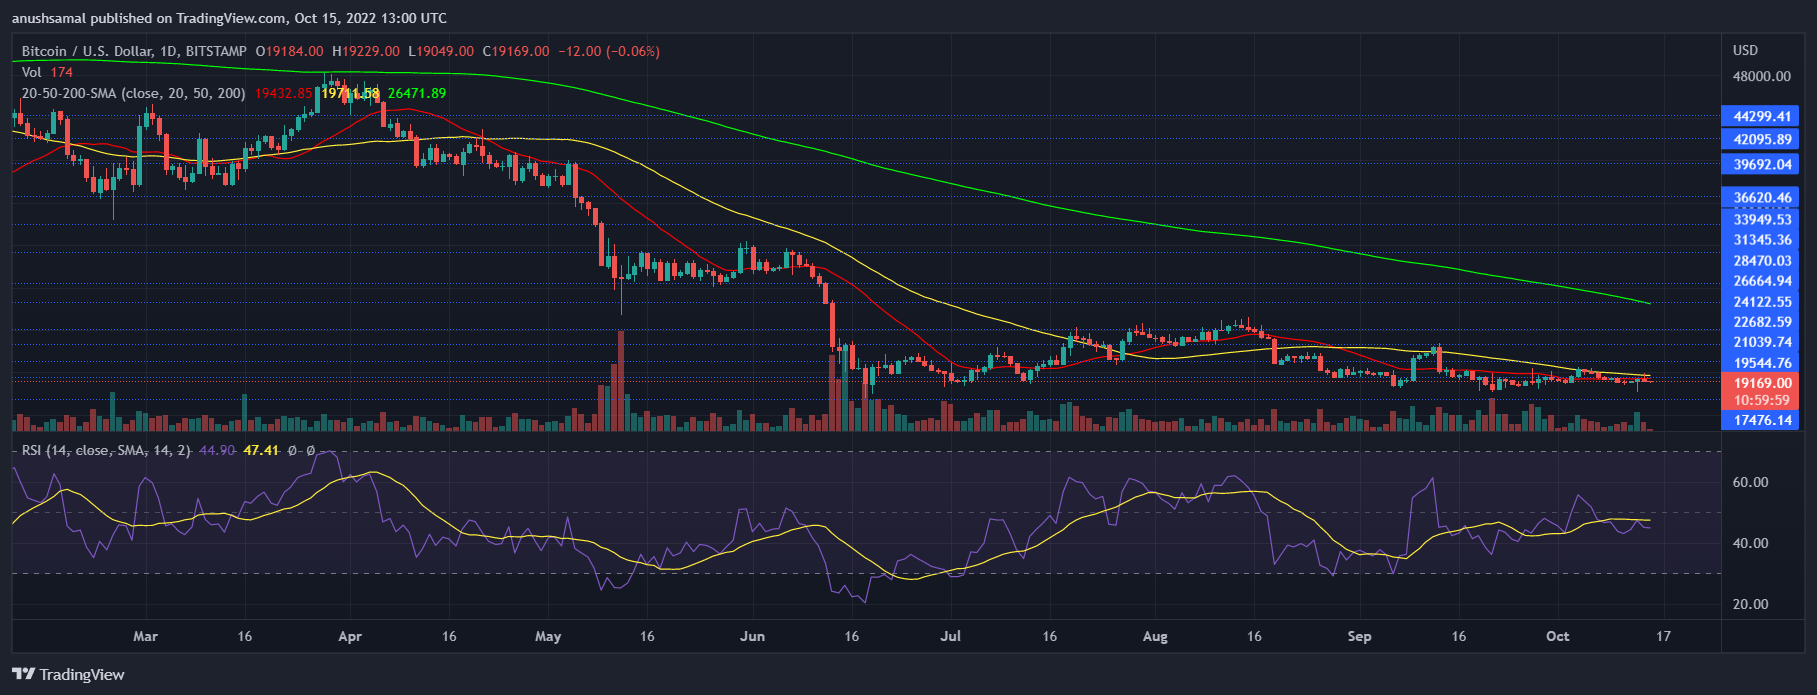 Bitcoin saw an increase in sellers on the one-day chart | Source: BTCUSD on TradingView
The coin showed that buyers were beginning to lose confidence and sellers took over as it struggled to move above immediate resistance. The Relative Strength Index was parked below the half line, meaning buying power remained low on the chart.
If the buyers pick up the pace, Bitcoin can challenge its next price resistance level. Consistent with the same reading, the asset’s price was below the 20 SMA line and this was an indication that sellers were driving price momentum in the market at the time of writing.
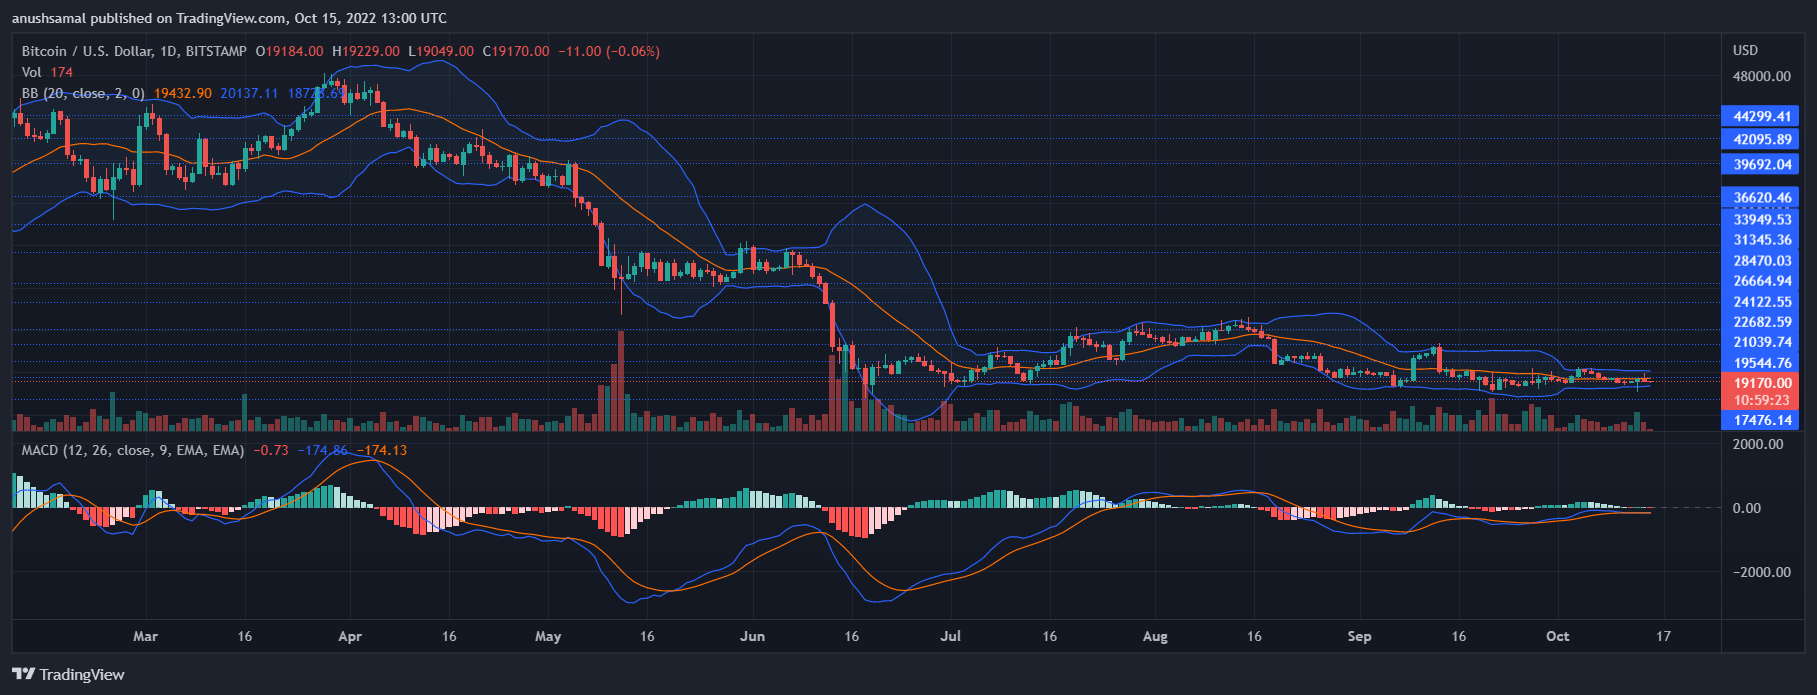 Bitcoin started showing sell signals on the one-day chart | Source: BTCUSD on TradingView
At the time of writing, BTC has been dominated by the sellers. The coin showed a sell signal, suggesting that the price could potentially fall further.
Moving Average Convergence Divergence shows the momentum and direction of the price, the MACD went through a bearish crossover and started showing tiny red histograms which were a sell signal.
Bollinger Bands show the volatility of the asset. The bands had narrowed completely, indicating explosive price action.
Learn Crypto Trading, Yield Farms, Income strategies and more at CrytoAnswers
https://nov.link/cryptoanswers