


After the long-awaited spot Bitcoin ETF approval, price action for investors did not go as expected. The price of Bitcoin (BTC) experienced a decline that brought the price below the $40,000 threshold. And it could be just the beginning.
A weekly chart closing below the $38,000 level could indicate a possible downturn for Bitcoin, with the focus on the robust support cluster at around $33,000.
This critical area includes several technical components, including the lower boundary of a parallel channel, the 0.5 Fibonacci retracement level, and the 50-week simple moving average, according to a Jan. 24 post by cryptocurrency analyst Ali Martinez on X
Possible further lows for BTC. Source: Ali Martinez
The convergence of these factors forms a notable line of defense that has the potential to prevent further declines in the price of first-party cryptocurrencies.
Historical movement as a possible prediction
Historical price movements could be a good indicator for investors as they may be able to replicate the same pattern as after previous notable events.
In December 2017, BTC experienced a surge in value in anticipation of the start of Bitcoin futures trading, only to subsequently suffer an 84% correction. A parallel event occurred in October 2021, when the flagship crypto experienced an uptrend ahead of the Bitcoin futures ETF approval, leading to a subsequent correction of 78%, according to a Jan. 23 post by investor Charlie Bilello .
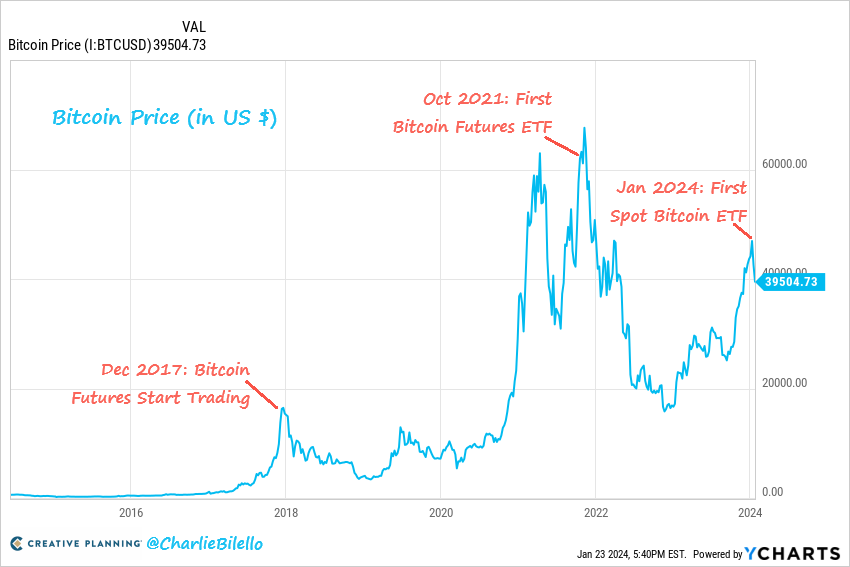 Historical price movement of BTC after notable events. Source: Charlie Bilello
A similar pattern emerged in January 2024 as the price rose ahead of the approval of the first spot Bitcoin ETF, although with a more moderate correction of 20% so far.
Could whales be responsible for the correction?
Addresses that hold large amounts of specific digital assets (so-called whales) can directly impact the price of the cryptocurrency based on their trading movements.
The latest data suggests notable activity among cryptocurrency whales across different holding classes. According to a Jan. 20 post by crypto educator Wise Advice, wallets with values between $100,000 and $10 million have seen a 3% decline over the past six months, while wallets with values between $10,000 and $10 million have seen a decline since August recorded a decline of 4%.
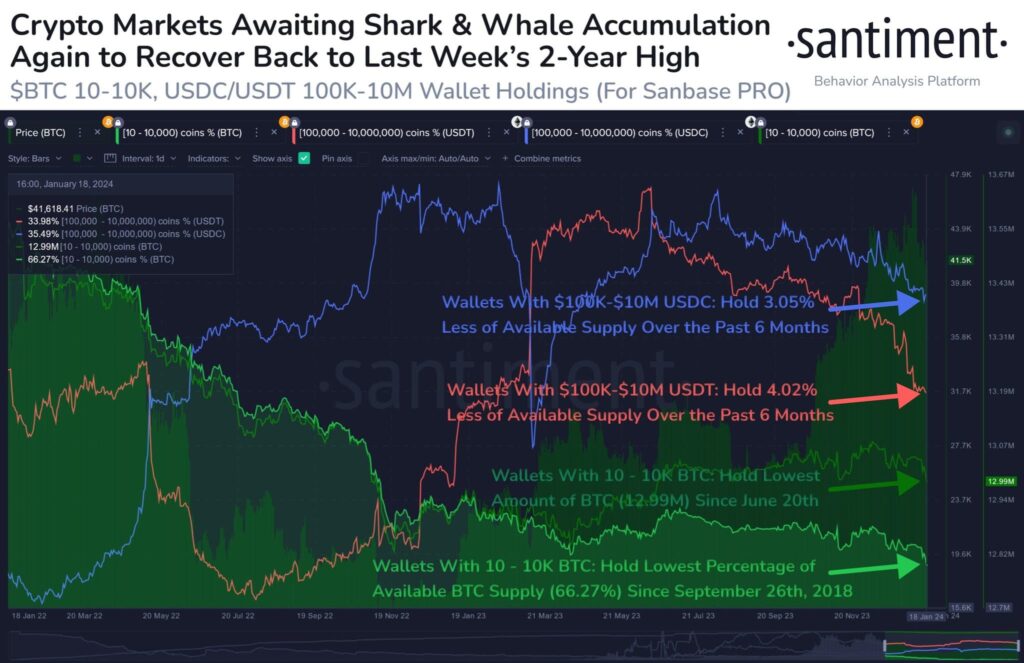 Whales BTC sales activity between wallets of different sizes. Source: Smart Advice
Interestingly, wallets holding 10,000 to 10 million BTC remain at their lowest levels since June 2023, indicating a possible selling or distribution trend by these holders.
Bitcoin price analysis
At press time, BTC was trading at $39,926, having gained 1.25% the previous day, in contrast to losses of -6.52% last week and a decline of -8.50% last Month.
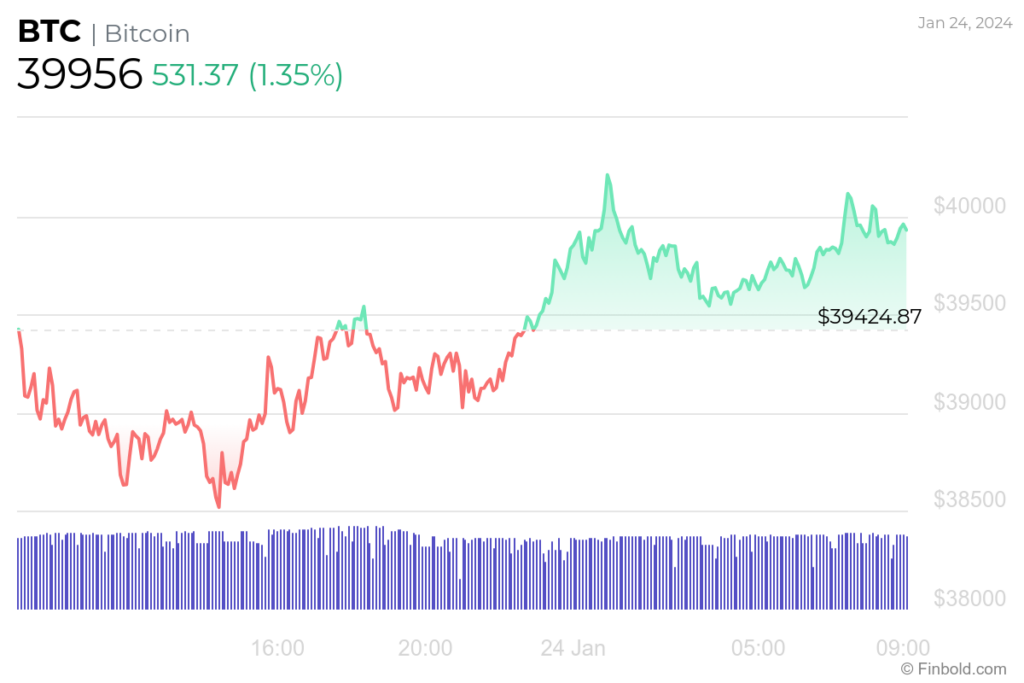 BTC 24 hour price chart. Source: Finbold
Technical indicators paint a contrasting picture: the overall rating is “Neutral” at 7 and the moving averages are sloping toward “Sell” at 9. Meanwhile, at 4, the oscillators are moving towards “buy”.
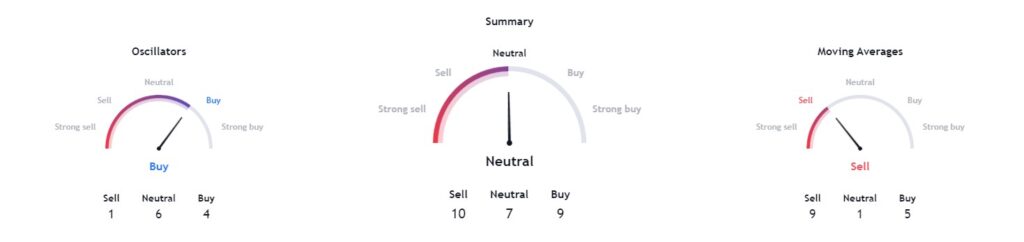 Technical analysis of BTC price. Source: TradingView
With historical data, trading sentiment and price analysis all against Bitcoin, further declines are likely, which could provide investors with an opportunity as an entry point.
Disclaimer: The content of this website should not be considered investment advice. Investing is speculative. When you invest, your capital is at risk.
Learn Crypto Trading, Yield Farms, Income strategies and more at CrytoAnswers
https://nov.link/cryptoanswers
Comments are closed.