


Denys Serhiichuk
Can the Cryptocurrency Market Stay Bullish in the First Days of August?
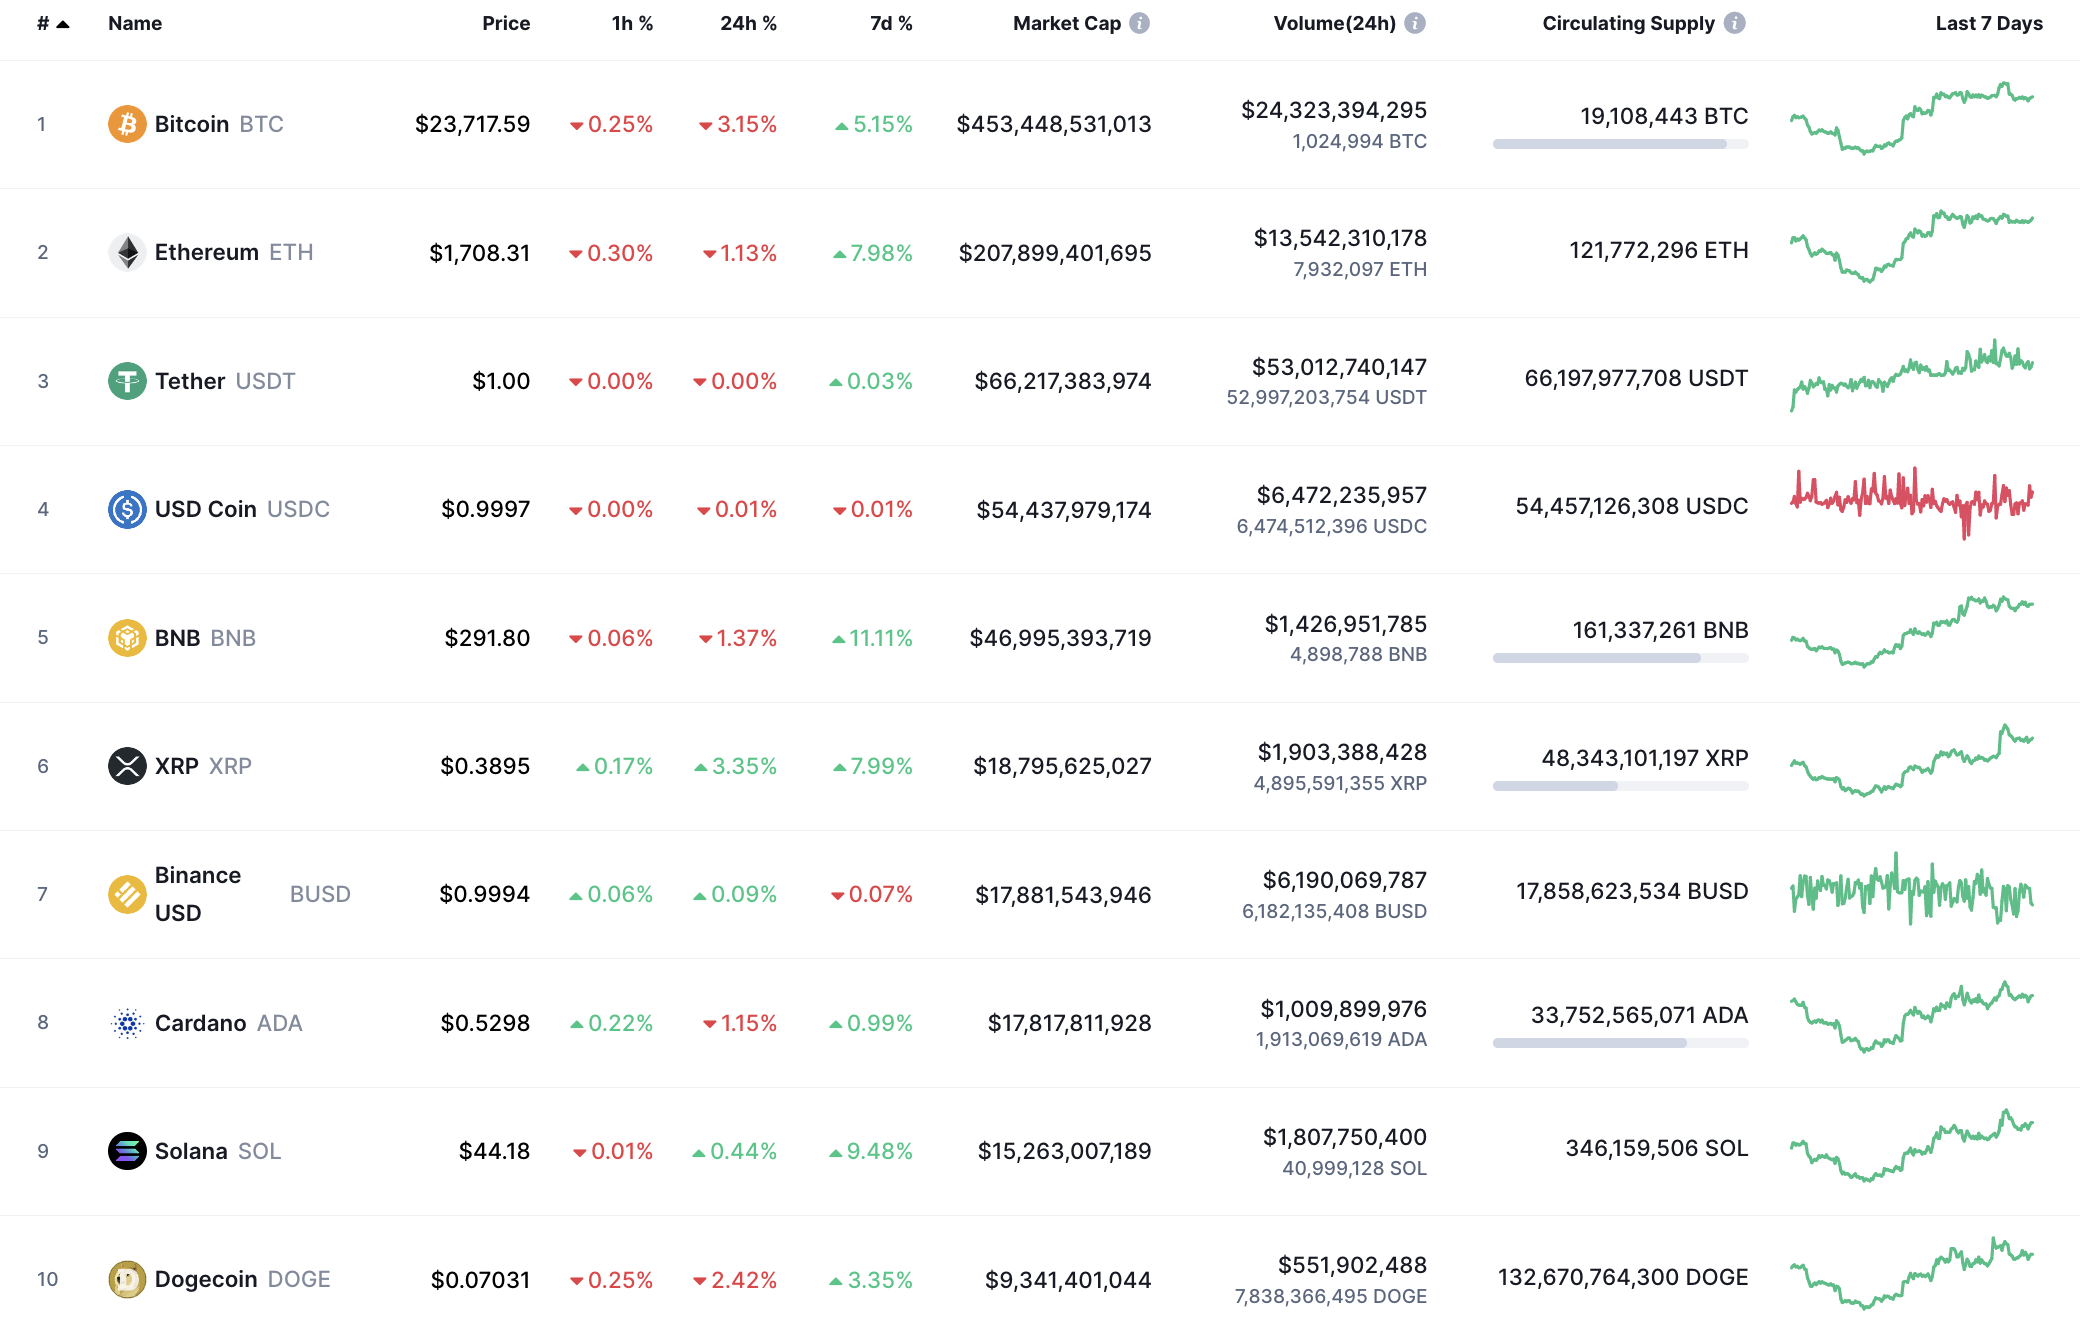
Most coins faced a correction period on the last day of the week.
BTC/USD
Despite the slight drop, Bitcoin (BTC) price is up 5.19% over the past 7 days.
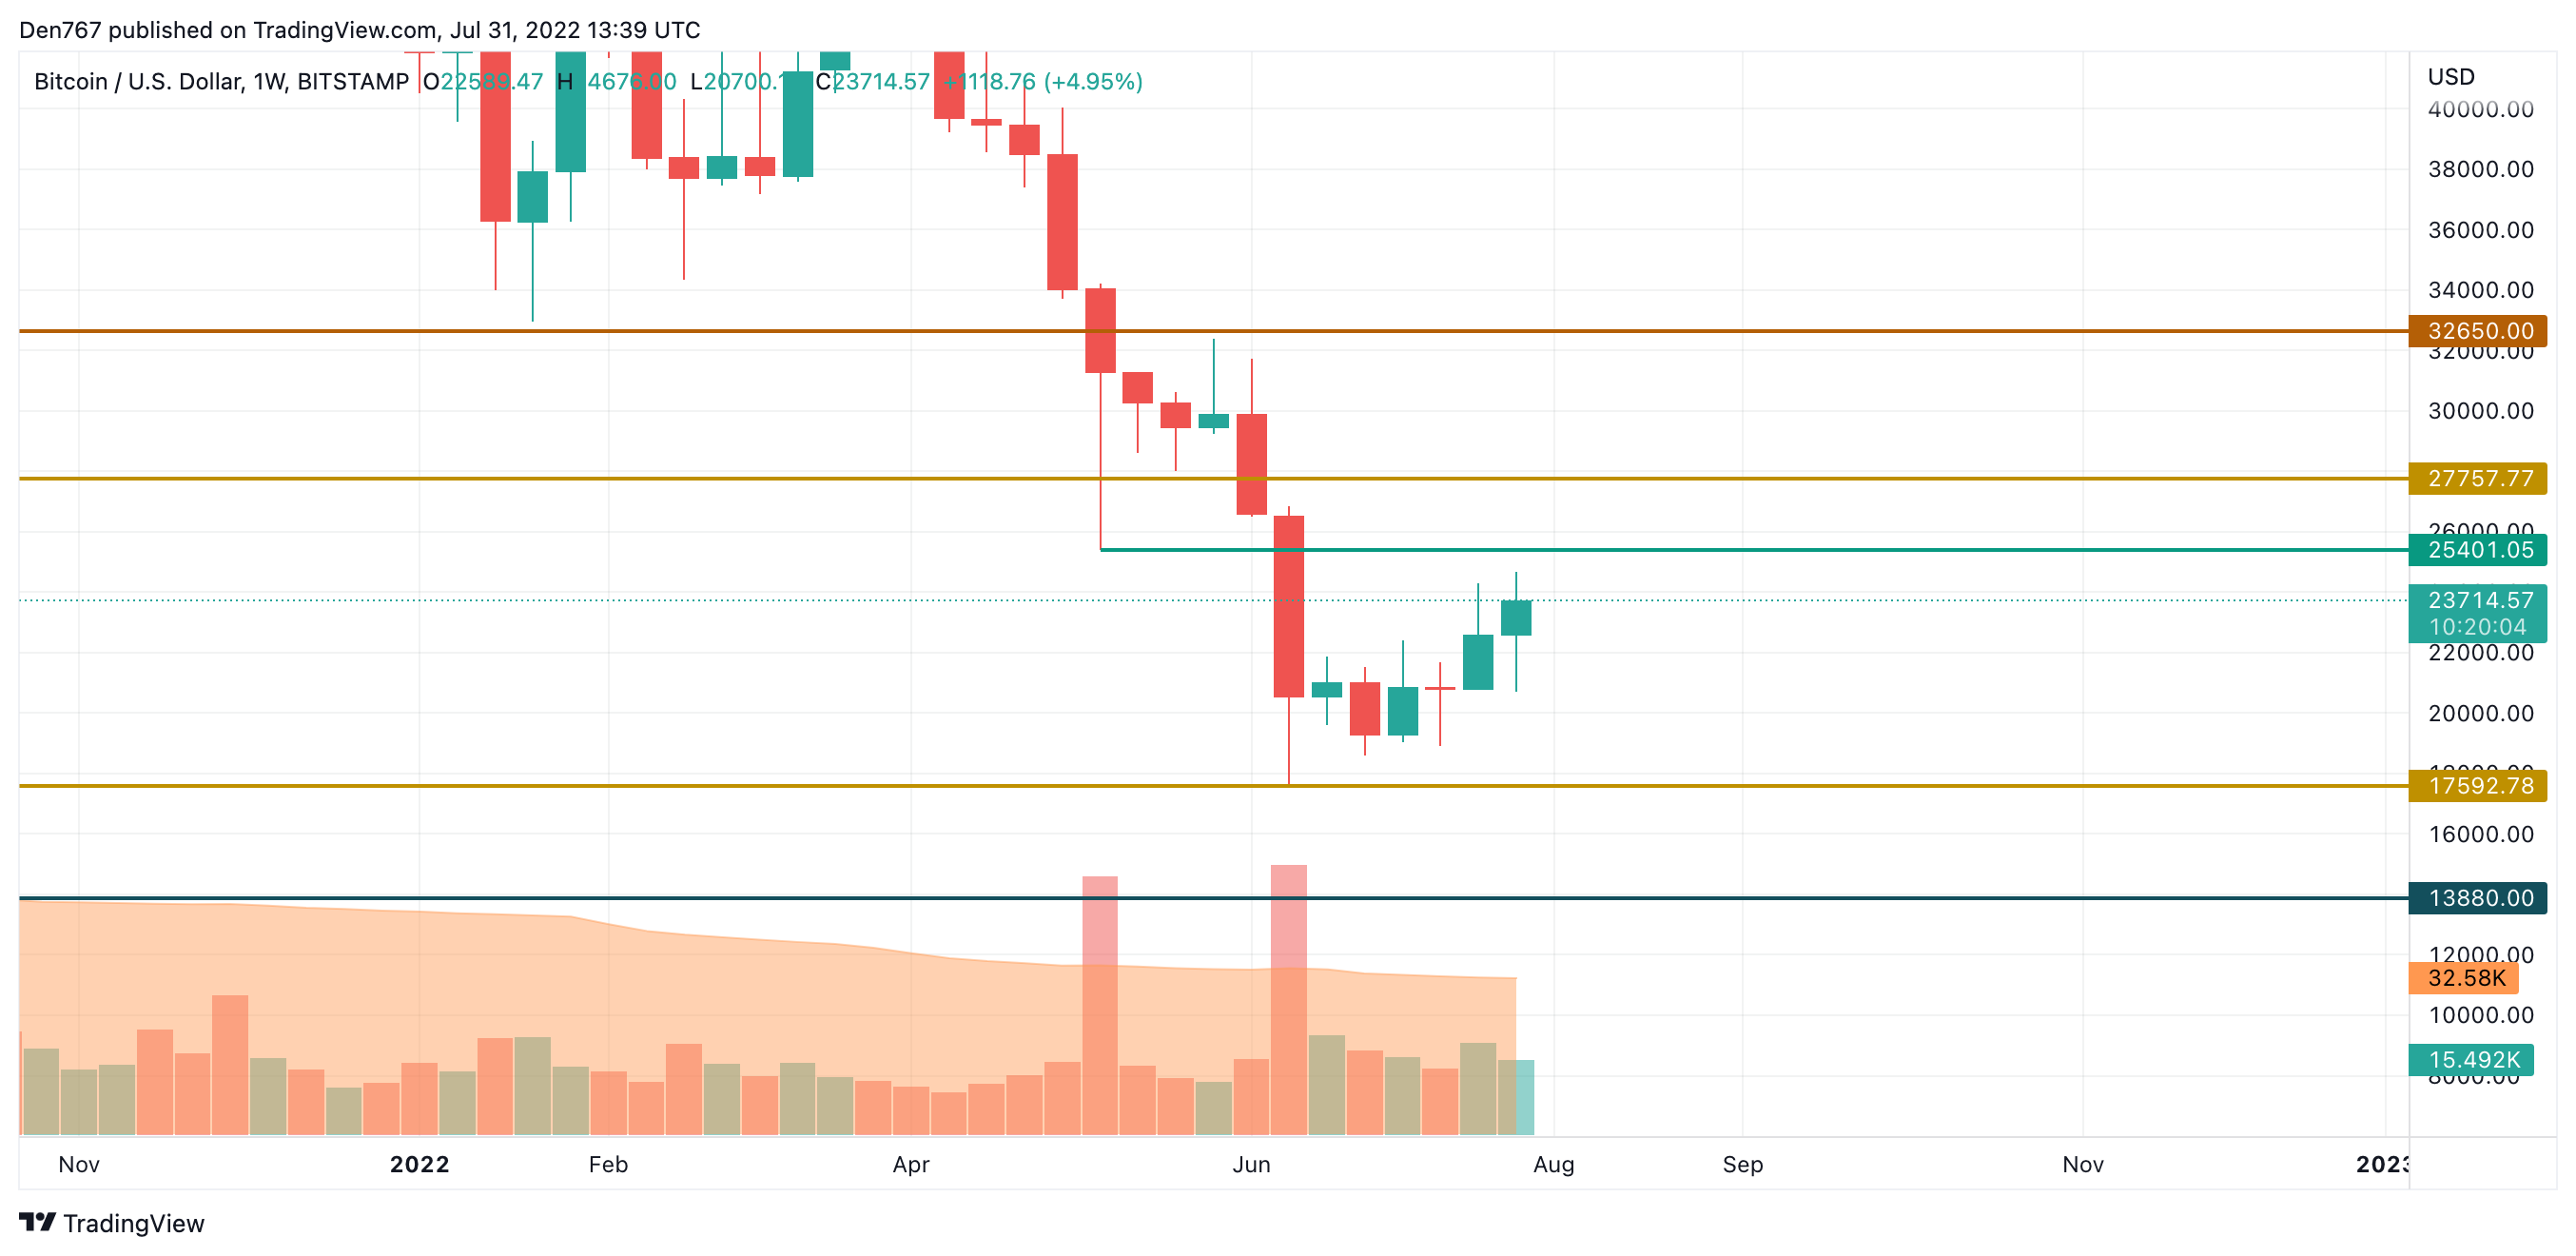
On the weekly chart, Bitcoin (BTC) is looking bullish as the price remains above the $23,000 level. If the bulls can retain the initiative, a further increase into the $25,000 zone can be expected in the first days of next month.
Such a scenario is relevant until mid-August.
Bitcoin is trading at $23,710 at press time.
ETH/USD
Ethereum (ETH) has gained even more than Bitcoin (BTC) as the rate is up almost 8%.
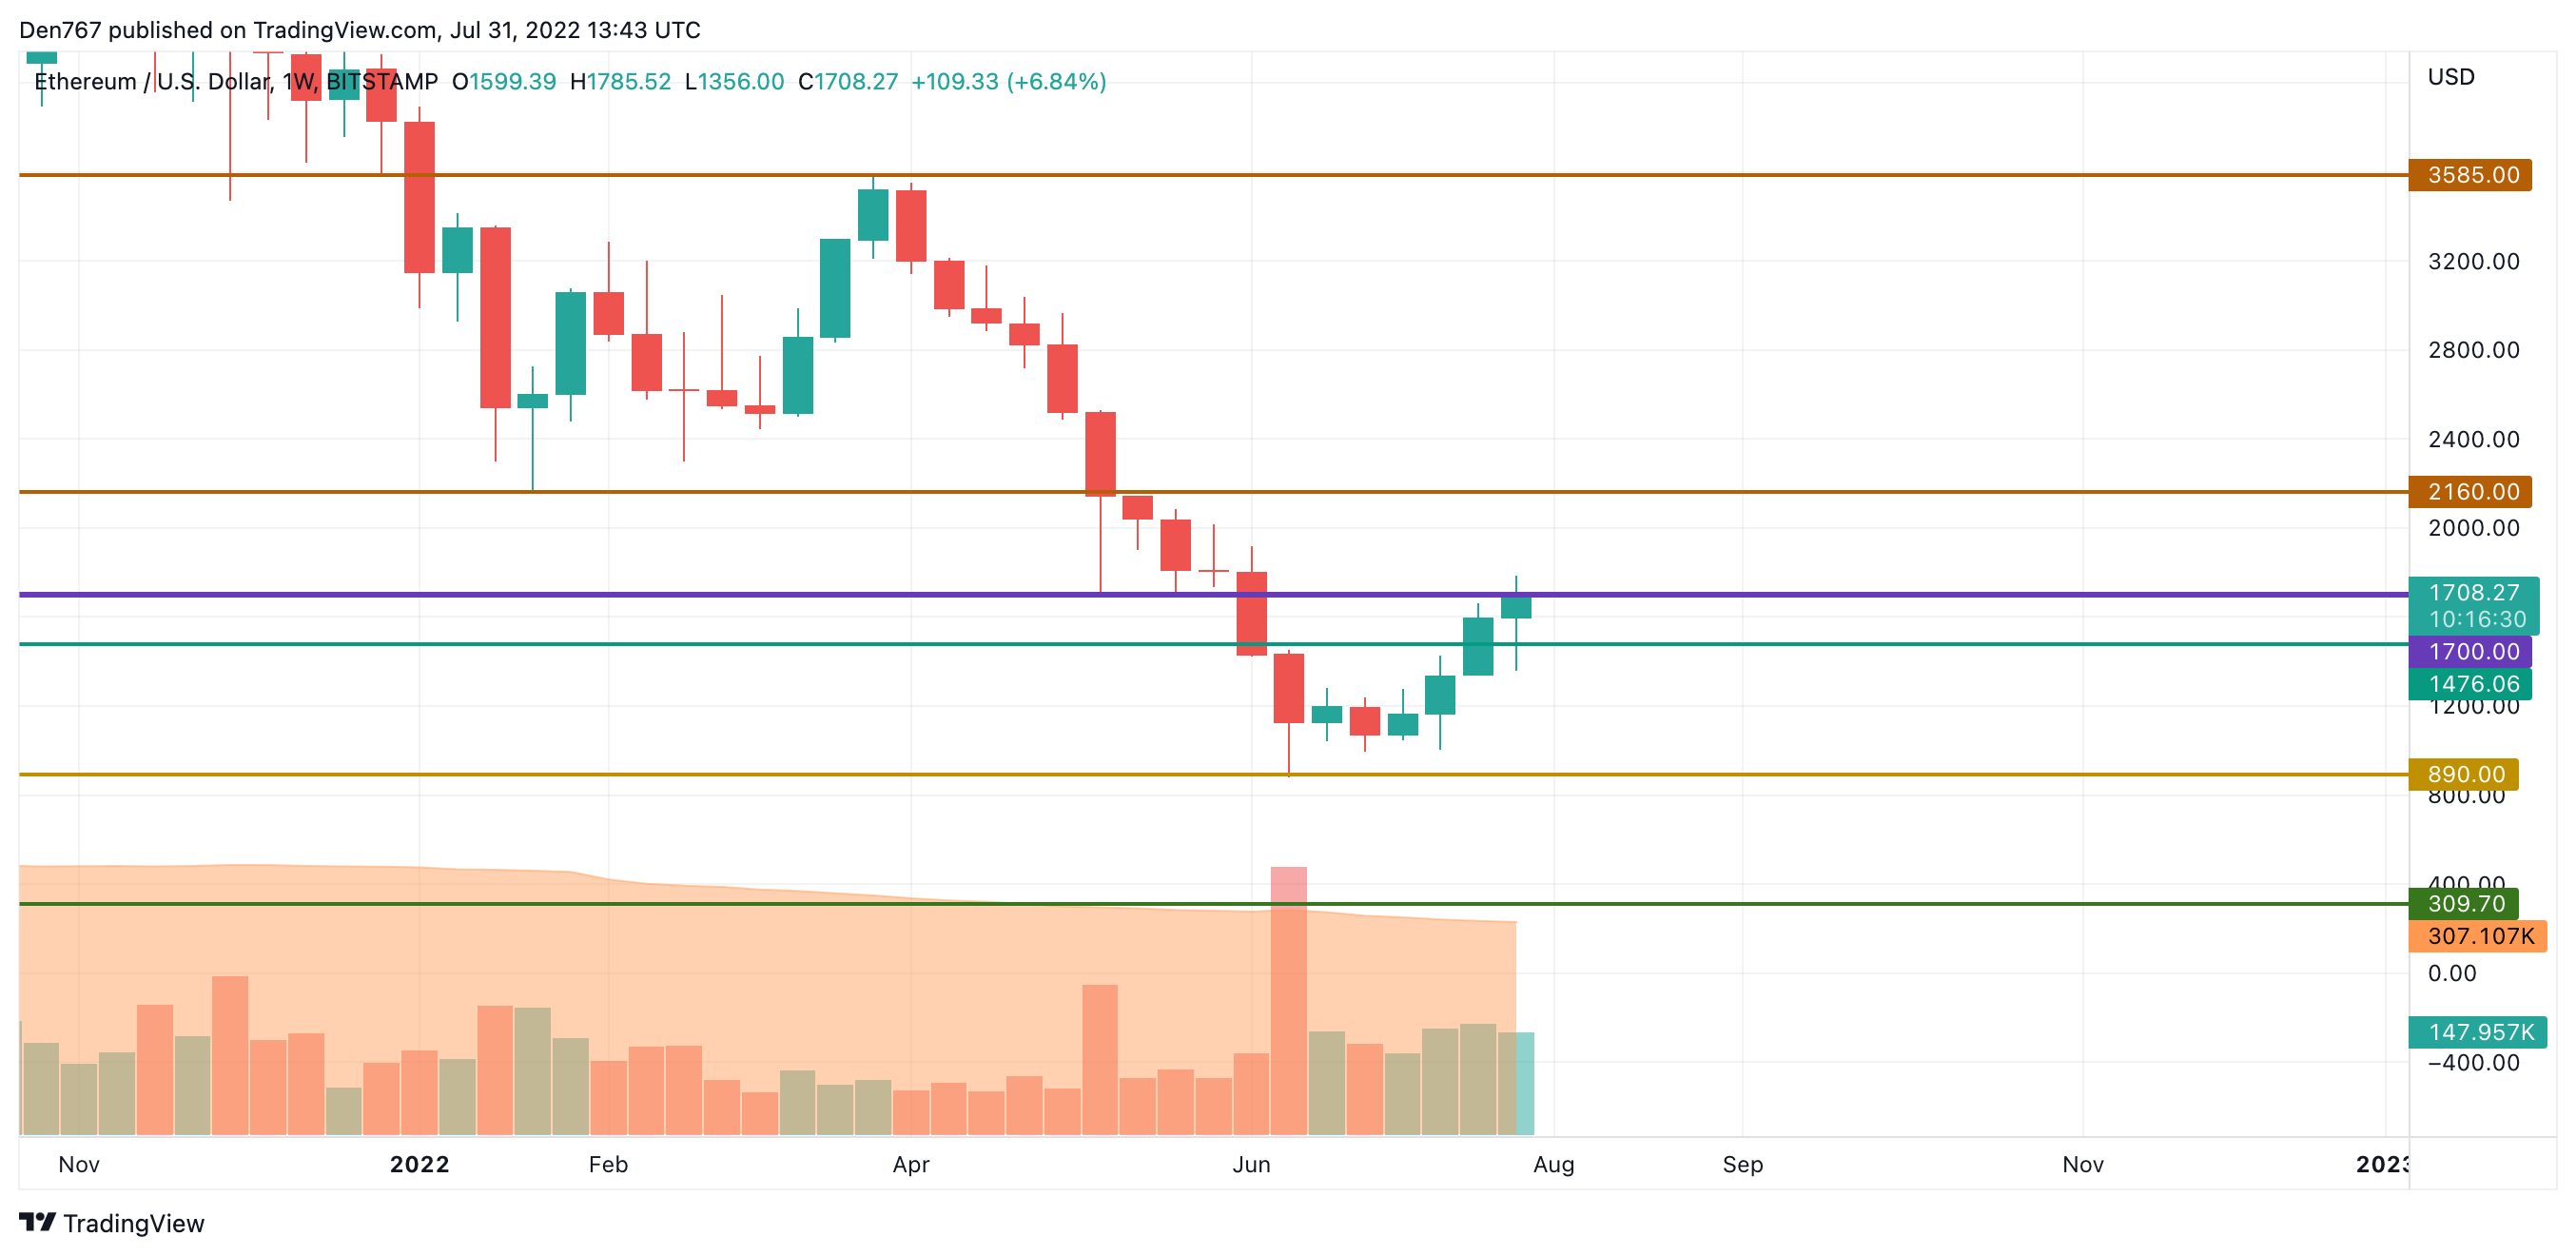
Ethereum (ETH) has continued to climb after the false breakout of the $1,476 mirror level. In this case, the more likely scenario is a test of the $1,900-$2,000 area within the next few days.
Ethereum is trading at $1,711 at press time.
XRP/USD
XRP is showing the same growth as Ethereum (ETH) and is up 8%.
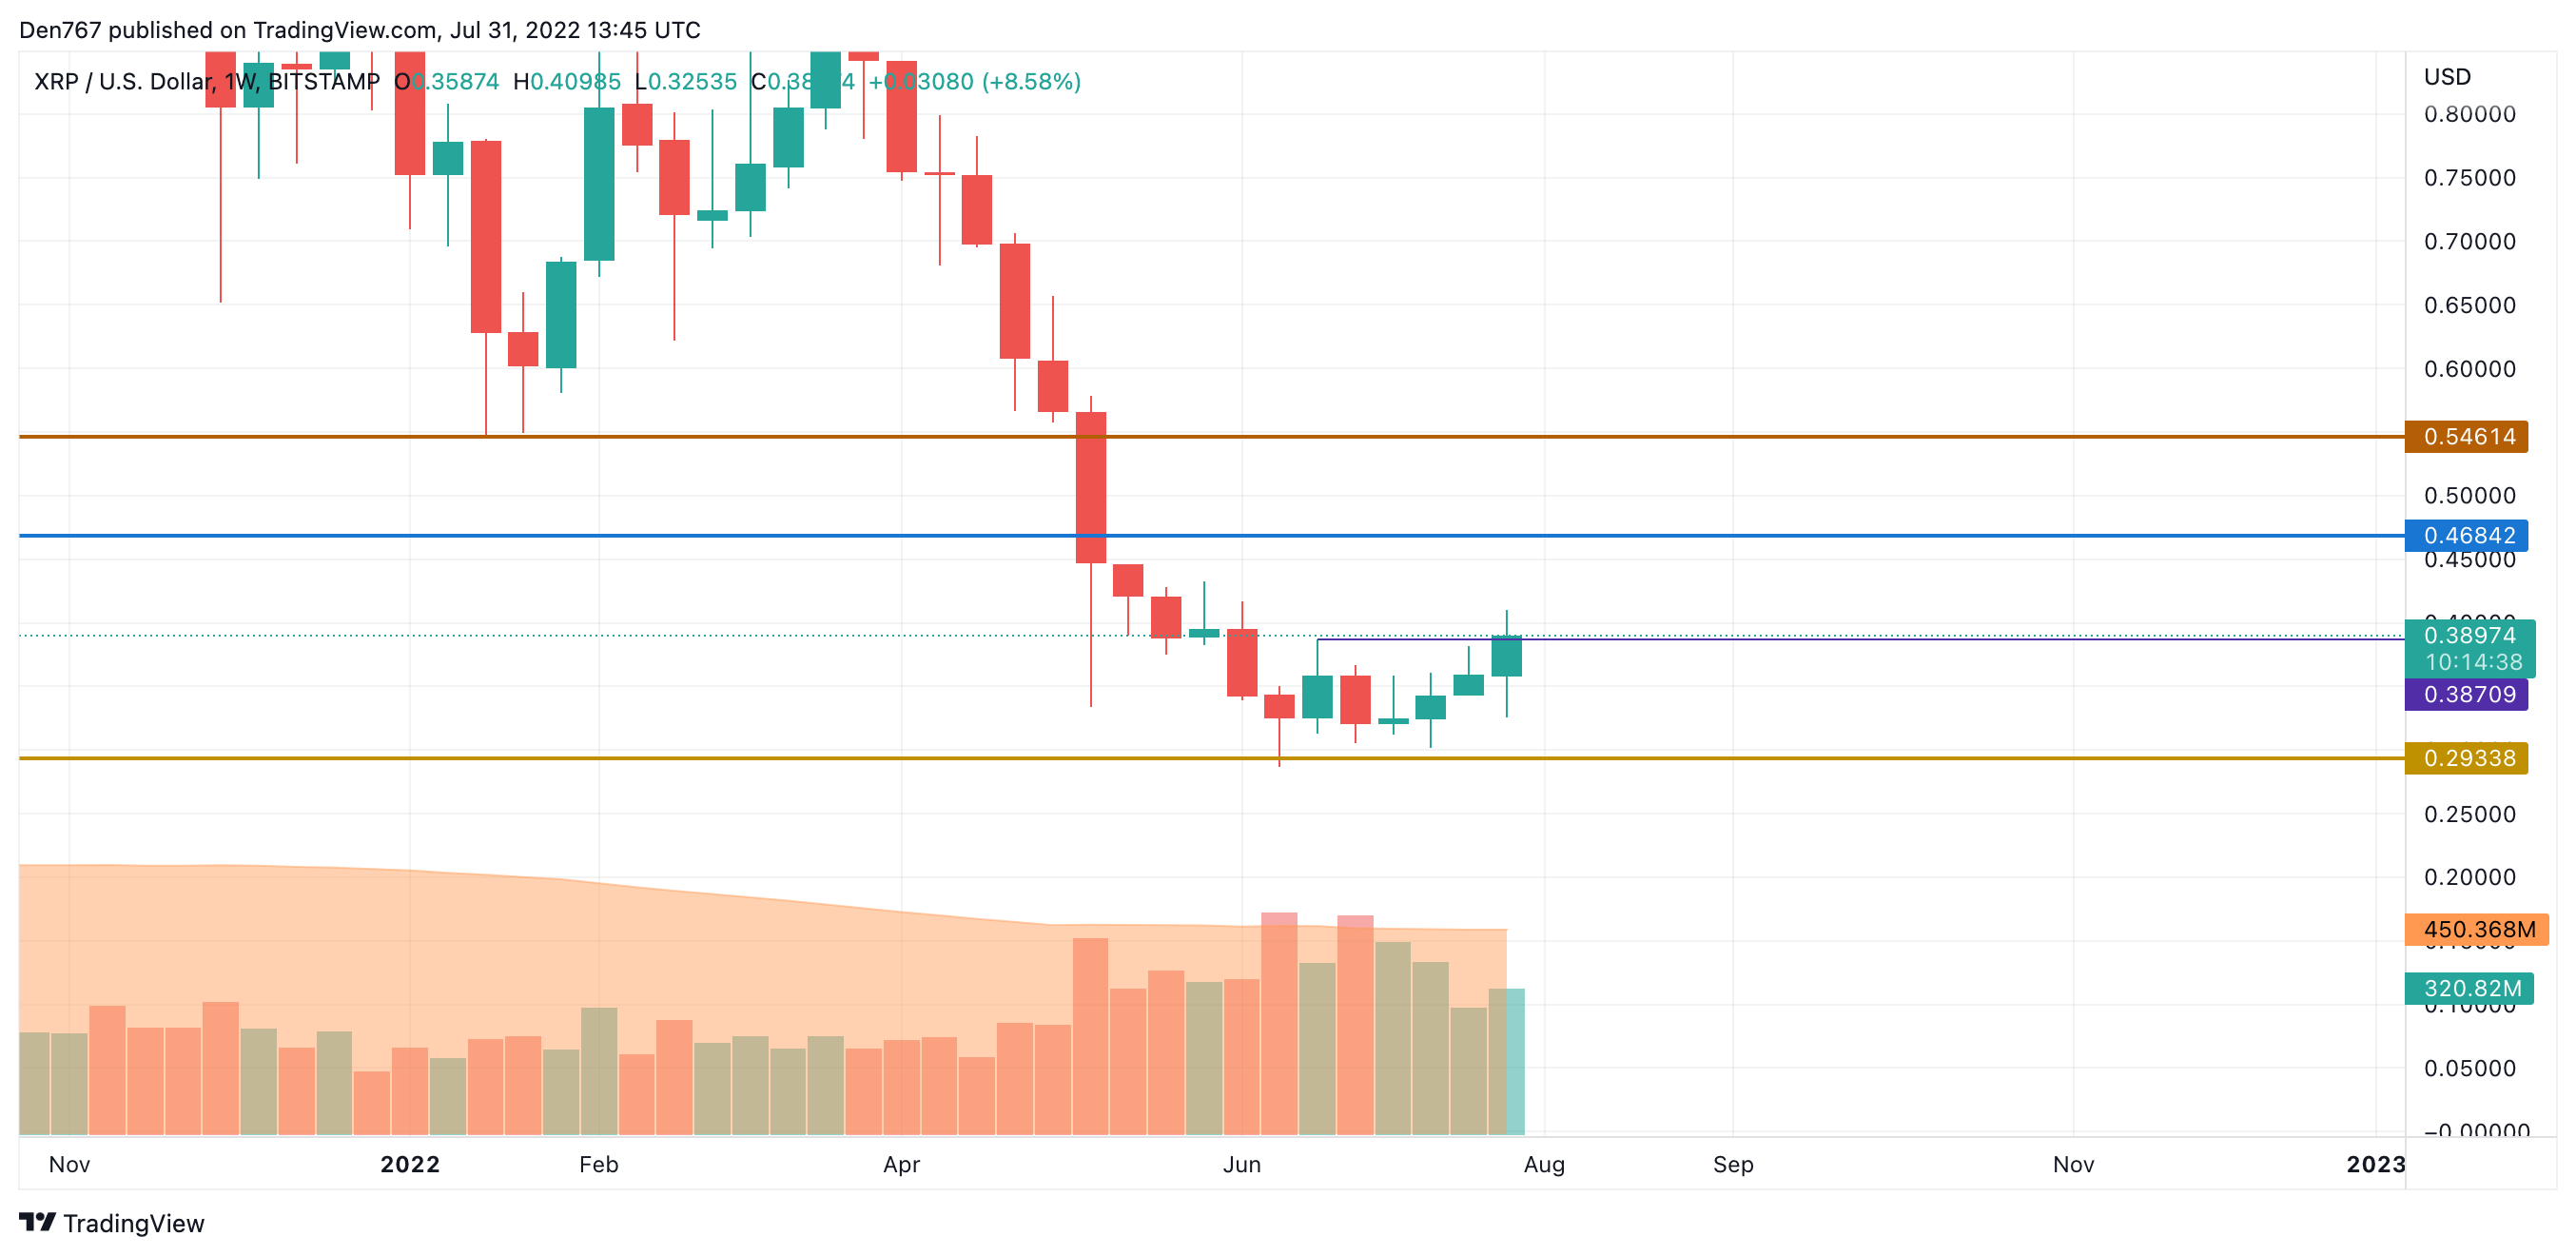
XRP is trading near its resistance level at $0.3893 on the weekly chart. If the candle closes above this level, there is a high possibility that a strong bullish move to the $0.40 zone will be seen soon.
XRP is trading at $0.3895 at press time.
Learn Crypto Trading, Yield Farms, Income strategies and more at CrytoAnswers
https://nov.link/cryptoanswers
Comments are closed.