


In today’s on-chain analysis, BeInCrypto examines indicators that compare the current market situation of short- and long-term Bitcoin (BTC) holders. The goal is to determine what phase of a bear market BTC is in.
Historical on-chain analysis shows constant tension between the two types of holders, for which the demarcation line is 155 days. During bull markets, long-term holders (LTHs) systematically sell their BTC in favor of short-term ones. They realize profits, reduce risk, and usually get rid of most of their wealth at the peak of the bull market.
Conversely, Short-Term Holders (STHs). They sell their BTC during a bear market in favor of long-term holders who accumulate during that time. On the other hand, when prices are rising, they like to buy because they expect the upward trend to continue. At the peak of the bull market, they are left with expensive sacks of coins that fall in value dramatically. In contrast, at the bottom of a bear market, they have almost no funds left.
The relationship between short-term and long-term holders
The historical relationship outlined above is illustrated by a chart of the relationship between short and long term holders. It is a chart of the amount of circulating supply held by long and short holders in profit or loss.
In the previous bear markets of 2014-2015 and 2018 and the crash of 2020, getting to the green zone was associated with the process of BTC hitting the bottom. The green area is in the 0.25 to 0.28 range and indicates a situation where most of Bitcoin’s supply (more than 70%) remains in the hands of long-term owners.
Source: Twitter
Bitcoin analyst and enthusiast @StackSmartly wrote in a comment on this chart that “short-term holders are essentially dead.” He then added: “Only smart money survived. Healthy sign for #Bitcoin.”
cost basis
Another indicator that helps gauge the stage of a Bitcoin bear market is the so-called cost basis for two types of holders. In financial jargon, the cost basis is used to determine whether an investment was profitable or not. The cost basis helps calculate capital gains or losses, which is the difference between the selling price and the buying price.
Looking at the on-chain indicators that calculate the cost basis for two types of BTC holders, we see two different values. For long-term hodlers, the current cost baseline (green line) is around $22,000. This means that despite the ongoing declines, long-term holders are still making gains in the market.
In contrast, the cost basis for short-term holders (orange line) is just under $40,000 today. This implies that they are making a loss as the coins they hold are below the purchase price.
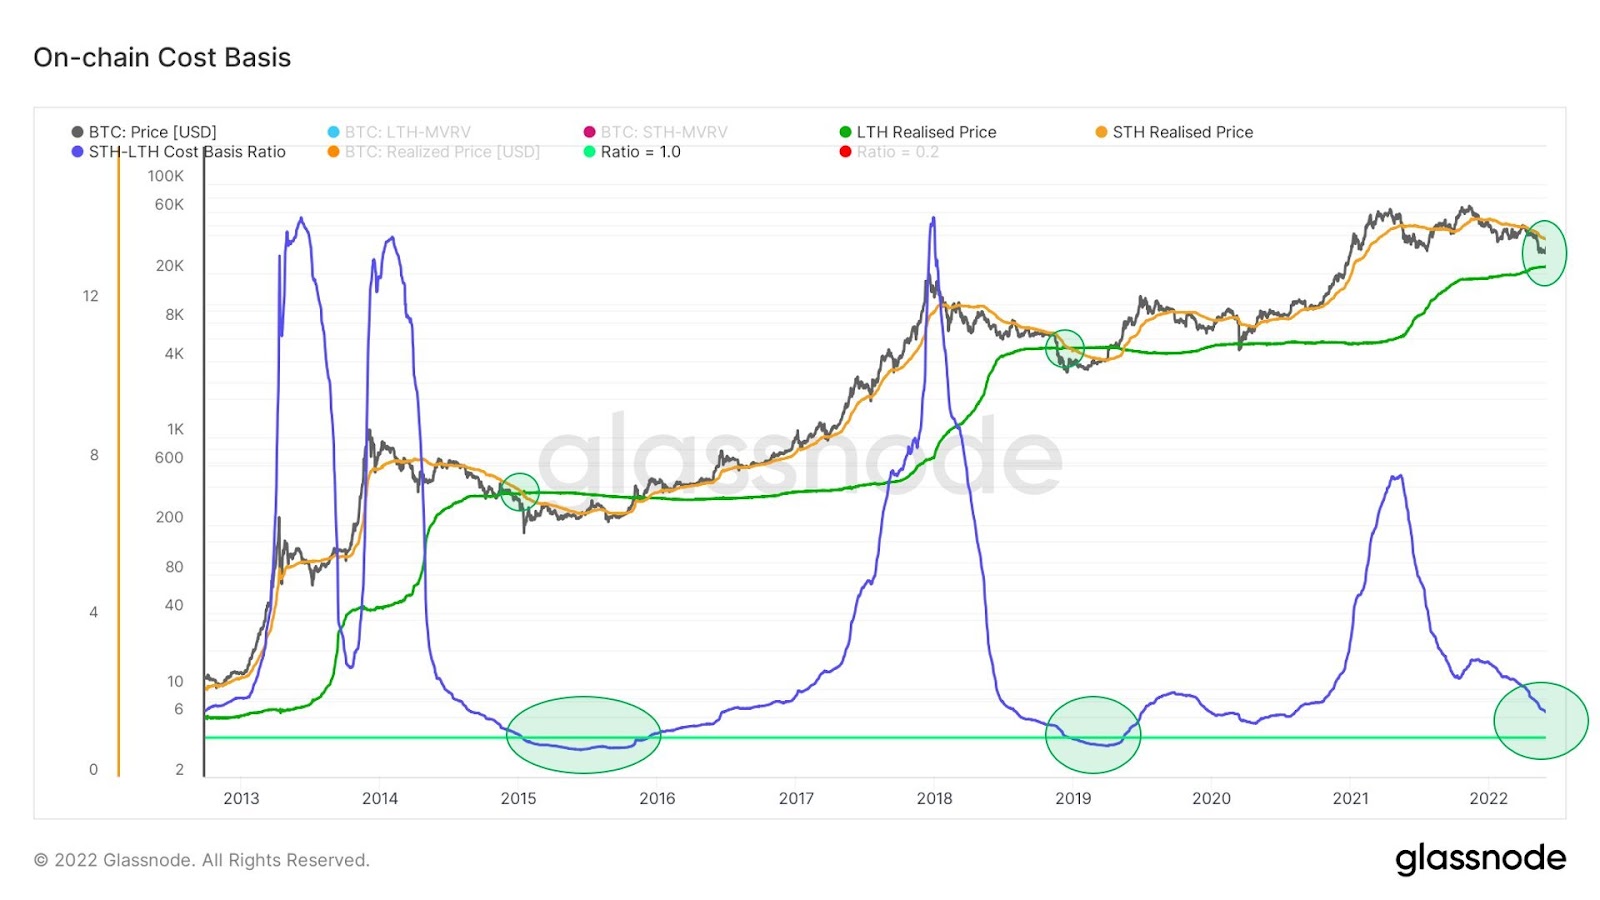
STH-LTH cost basis ratio
An additional indicator of the overall health of the BTC market is what is known as the STH-LTH cost basis ratio (blue line). It is calculated from the ratio of the realized LTH and STH price. Historically, when the orange STH line crossed below the green LTH line, the STH-LTH cost basis ratio determined the best opportunities to buy bitcoin (green and blue areas).
In the current market situation with BTC price close to $30,000, the two lines have not yet crossed and the STH-LTH cost basis ratio has not fallen to an all-time low. This suggests that BTC price may need to drop to lower levels to repeat conditions from the end of previous bear markets.

For the latest Bitcoin (BTC) analysis from BeInCrypto, click here.
Disclaimer
All information contained on our website is published to the best of our knowledge and belief and for general information purposes only. Any actions taken by the reader based on the information contained on our website are entirely at your own risk.
Learn Crypto Trading, Yield Farms, Income strategies and more at CrytoAnswers
https://nov.link/cryptoanswers
Comments are closed.