


Cardano price is being propelled higher by the bulls on its chart at the time of writing. Over the past day, Cardano is up 2%. Over the past week, the altcoin’s price action has not been positive as it shed most of the gains for the week.
A sustained buyers rally could propel ADA above its next resistance level. However, at the time of writing, ADA is trading sideways.
The altcoin has remained sandwiched between $0.50 and $0.44 for the past few weeks.
Although buying power was trying to recover on the chart, at the time of writing, selling power was still dominating.
Cardano price support zone is between $0.44 and $0.40 respectively. Cardano was one of the altcoins that went against the tide.
However, Bitcoin has shown signs of appreciation over the past 24 hours. ADA bulls can quickly fade if the coin’s purchasing power does not move into positive territory.
Cardano Price Analysis: One-Day Chart
Cardano was priced at $0.46 on the one-day chart | Source: ADAUSD on TradingView
ADA was trading at $0.46 at the time of writing. In the last 24 hours, the coin has surpassed one of its resistance levels.
The immediate resistance level for Cardano was $0.49. If the bulls manage to scale above the $0.49 price level, the bulls may stay in place longer.
If buyers don’t call in, Cardano price will drop to $0.43 and then below $0.40.
The amount of altcoins traded over the past session declined despite an increase in purchasing power. This meant seller dominance in the market.
Technical Analysis
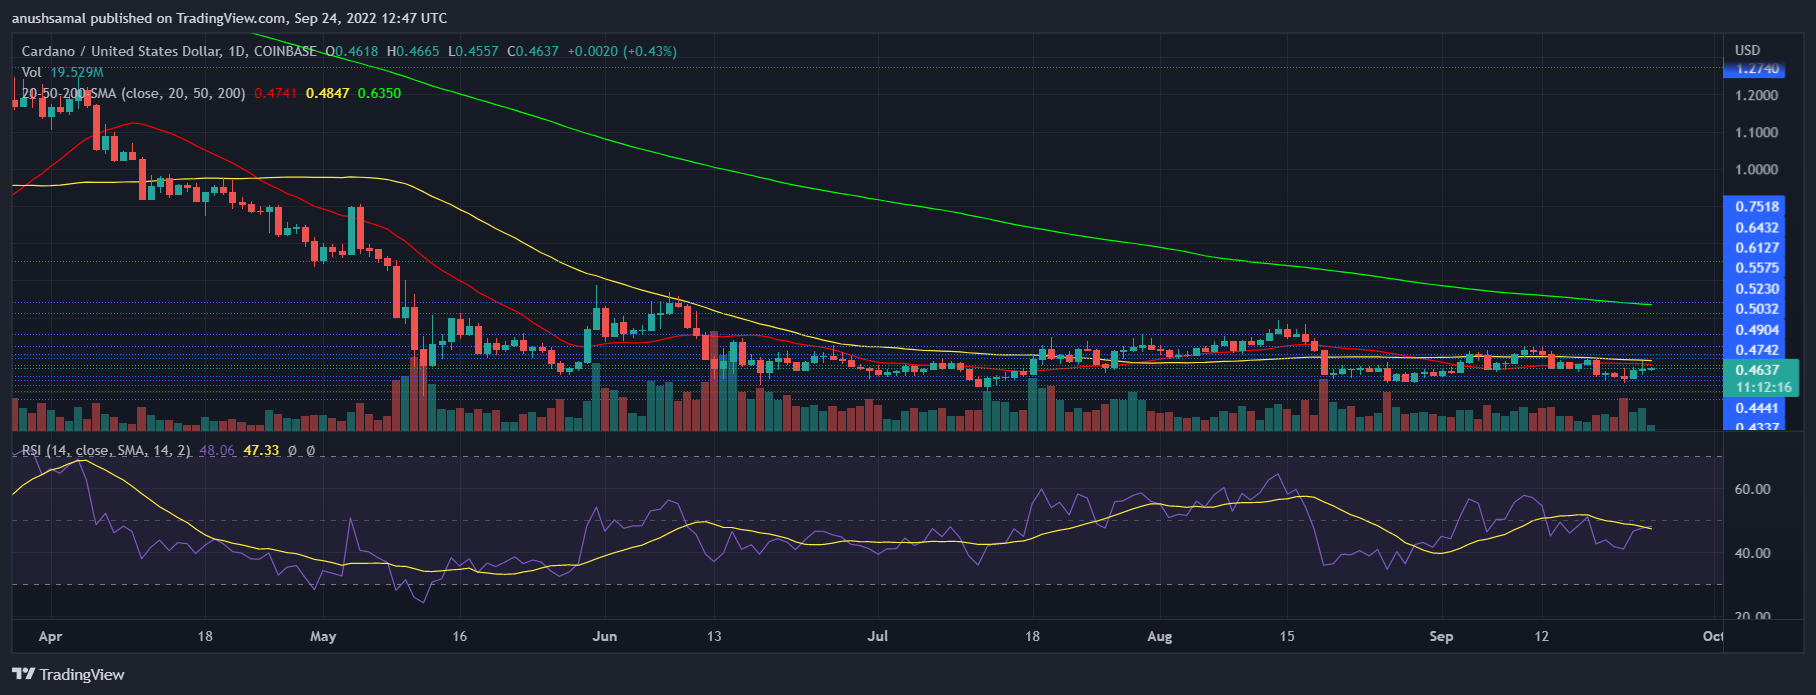 Cardano registered an increase in buying pressure on the one-day chart | Source: ADAUSD on TradingView
The altcoin is showing signs of recovery on the one-day chart. Technical indicators pointed to the bulls takeover.
At the time of writing, the Relative Strength Index is below the half-line, indicating that buying pressure has continued to outweigh selling pressure.
Cardano price traded below the 20 SMA line and that meant less demand as sellers boosted price momentum in the market.
With a nudge from buyers, ADA could surge above the 20-SMA and 50-SMA lines, invalidating the bearish thesis.
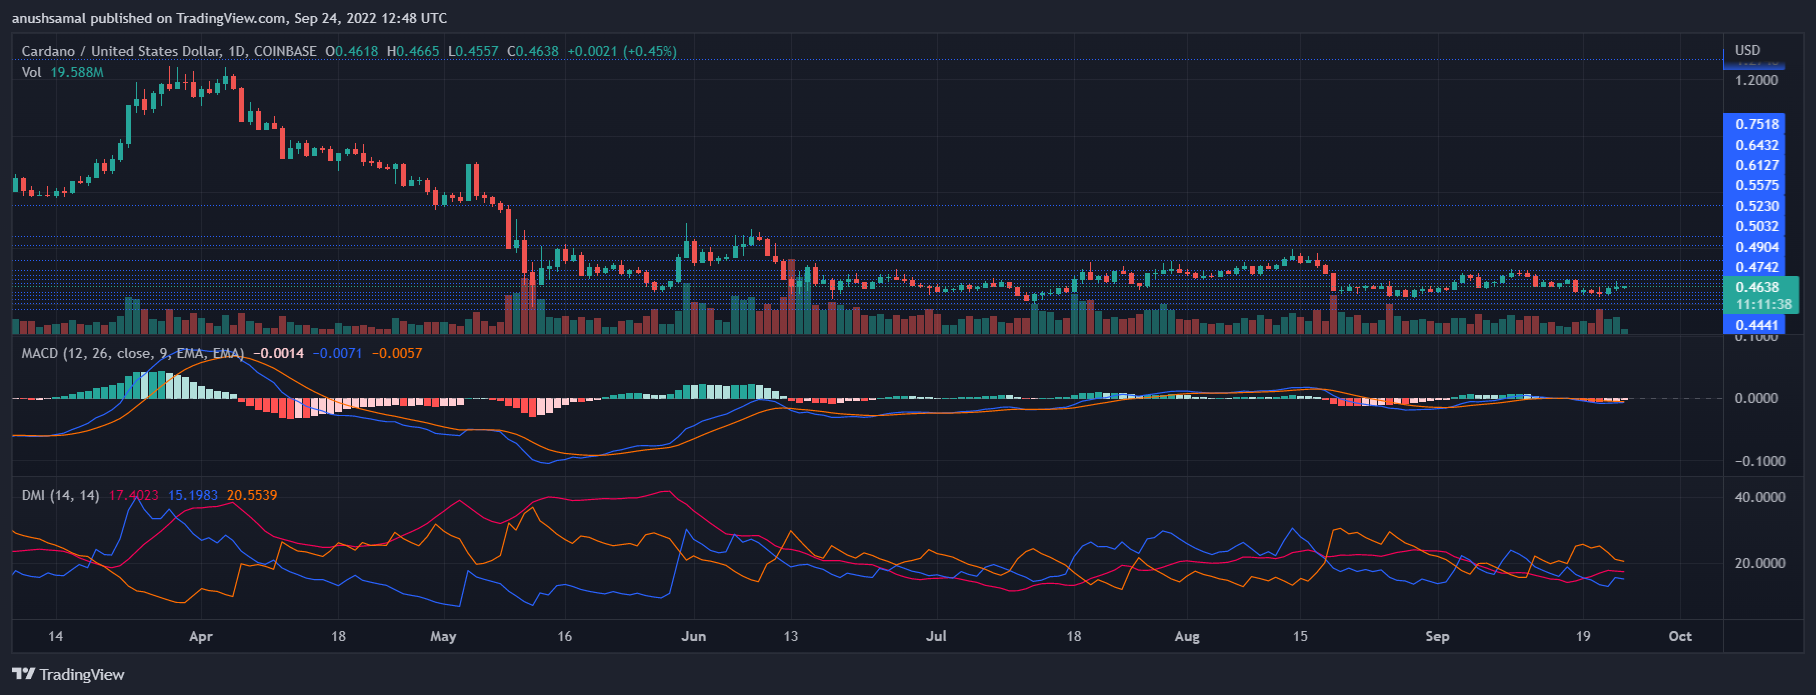 Cardano generated a sell-signal on the one-day chart | Source: ADAUSD on TradingView
ADA’s bulls have still not gained momentum on the one-day chart. Unless the buyers overcome the strength of the sellers, the bulls will not be able to propel the altcoin’s price above $0.49.
The Moving Average Convergence Divergence indicates the altcoin’s price momentum and price action. The MACD underwent a bearish crossover and formed red histograms that were a sell signal for the coin.
The Directional Movement Index measures general price direction. The DMI was negative because the -DI line was above the +DI line.
The Average Directional Index moved towards the 20 level, which is a sign that the current price action is gaining momentum.
Learn Crypto Trading, Yield Farms, Income strategies and more at CrytoAnswers
https://nov.link/cryptoanswers
Comments are closed.