

![Do you want to know if Bitcoin will rise? Check out Tether [USDT] Performance](https://i0.wp.com/trading-u.s3.amazonaws.com/wp-content/uploads/2024/04/17031531/1713338114_Bitcoin-Featured-Image-1000x600.webp.webp?fit=1000%2C600&ssl=1)
- Shortly before the halving, Bitcoin demand weakened.
- A recovery is predicted, but investors must remain patient.
Bitcoin [BTC] saw a decline in demand growth in April due to ETF inflows. Julio Moreno, head of research at CryptoQuant, published a chart showing the decline in demand on X (formerly Twitter).
Geopolitical tensions erupted in the Middle East over the weekend.
From early Monday's high of $66.8K, BTC rose 6% in a day to trade at $62.7K at press time. With the halving just three days away, will participants wait until the dust settles to purchase?
The strength declined throughout April
The trading volume behind Bitcoin began to steadily decline in the last week of March. According to data from Coinglass, open interest also started to decline after April 1st.
The Tether (USDT) dominance chart showed that crypto market participants increasingly converted their assets into USDT in April.
A rise in USDT dominance means the stablecoin accounts for a larger portion of the crypto market cap. This happens when more USDT is minted.
What's more interesting to us is that this happens even when traders and investors decide that the markets are risky and switch to holding stablecoins.
In other words, the market experienced an increase in selling pressure driven by high supply and a relative lack of demand. The strong optimistic sentiment at the end of March fluctuated in April and has been in the doldrums over the last ten days.
Uncertainty over whether miners would be able to offload some of their BTC holdings likely contributed to the lull in demand.
Will Tether Dominance Be Similar to 2020 Halving?
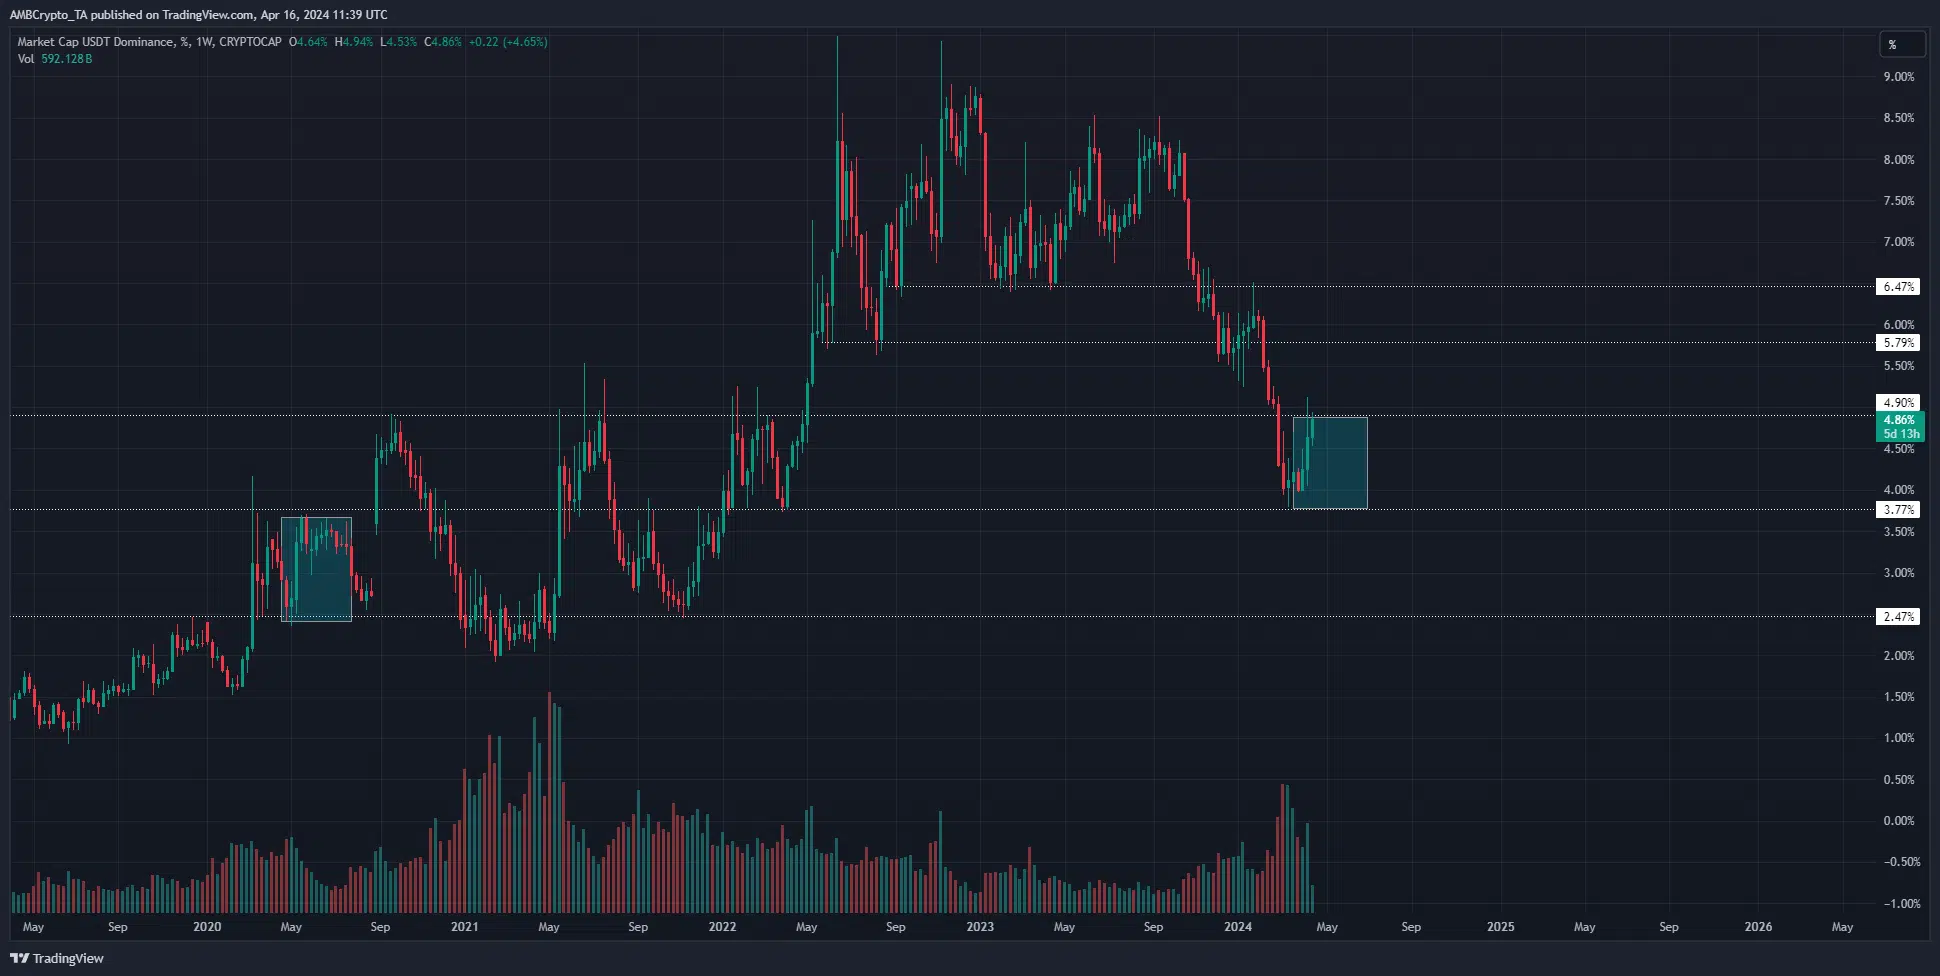
Source: USDT.D on TradingView
AMBCrypto examined the USDT dominance chart. From May 4th to May 18th, USDT.D rose higher. It then moved sideways at the 3.47% mark until July 20, eight weeks later.
The chart also currently shows a strong increase of 4% to 4.88%. If the similarities hold true, we could see crypto prices remain volatile over the next month or two.
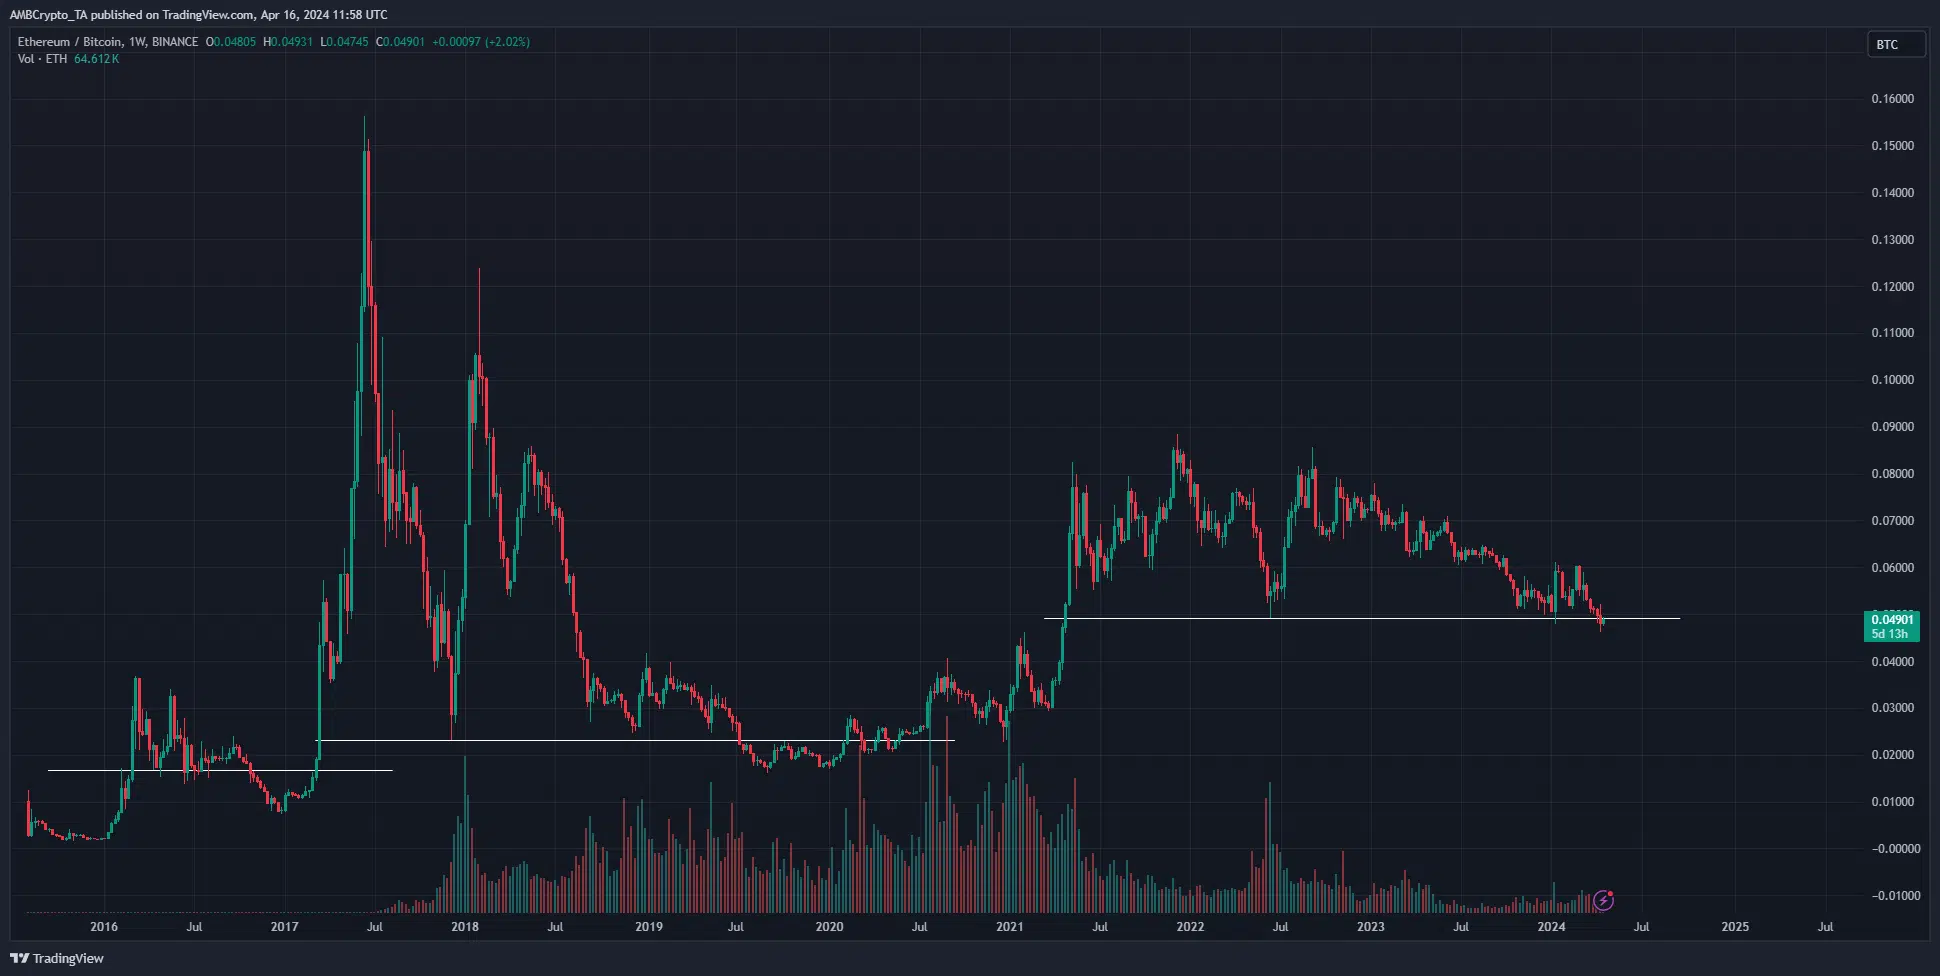
Source: ETH/BTC on TradingView
However, there are also arguments that dominance is increasing. This is evident from the ETH/BTC chart. Into The Cryptoverse founder Benjamin Cowen noted on X that ETH/BTC has lost an HTF support level.
Read Bitcoins [BTC] Price prediction 2024-25
The last time this happened was in July 2019. The increase began in September 2019. In the two months in between, both Bitcoin dominance and Tether dominance increased. Together they highlighted the capitulation of altcoins.
The same thing could happen in the next two months and investors should be prepared.
Next: Why is Shiba Inu so promising? Look closer
Learn Crypto Trading, Yield Farms, Income strategies and more at CrytoAnswers
https://nov.link/cryptoanswers
Comments are closed.