


Atomic Investor takes a close look at the Fear and Greed Index. He not only looks for temporary signals of prevailing emotions in the cryptocurrency market, but also those that can indicate long-term turning points.
Can the Fear and Greed Index be used to analyze Bitcoin cycles? Should we accumulate or sell our cryptocurrencies right now?
Cryptocurrency Market Sentiment Analysis
Emotions in any type of investment and non-investment markets are an important determinant of the behavior of many people, including investors. Volatility in the cryptocurrency market is high, and high volatility is accompanied by high emotions. This volatility in the case of the cryptocurrency market is illustrated very well by the Fear and Greed Index, which shows whether there is optimism (greed) or pessimism (fear) in the market.
Analyzing the historical data for the period 02/01/2018 – 12/31/2021 we can see that on annual average 57% fear (23% extreme fear, 34% fear) and 34% greed (21% greed, 13% extreme greed) . The number of occurrences only tells their statistics, but does not show the volatility of the market. From the collected data, moving averages of different time periods for fear (Fear + Extreme Fear) and for greed (Greed + Extreme Greed) were calculated. This shows how optimism and pessimism alternate in the cryptocurrency market.
Both the Fear vs Greed 50-SMA and Fear vs Greed 200-SMA charts show quite clearly that when the Bitcoin price rises significantly, greed increases and fear decreases. The opposite behavior is observed during Bitcoin declines – then fear dominates and greed falls. In the current situation you can see that the fear is quite high and the greed is low. Does this mean increases are coming?


Just the moving average counts of the sum of Fear + Extreme Fear and Greed + Extreme Greed already show how cyclically volatile the market is. However, there are no good signals to suggest that the market is in a sentiment that is better to exit slowly or to suggest accumulation. The idea would be to accumulate assets when overall fear is relatively high (and greed is relatively low). Conversely, one should average market exits when the behavior of the curves is exactly the opposite.
Analysis of the Fear and Greed Index moving averages
The next step focuses on the moving averages of the Fear and Greed Index itself as a resultant value of prevailing sentiment in the cryptocurrency market.
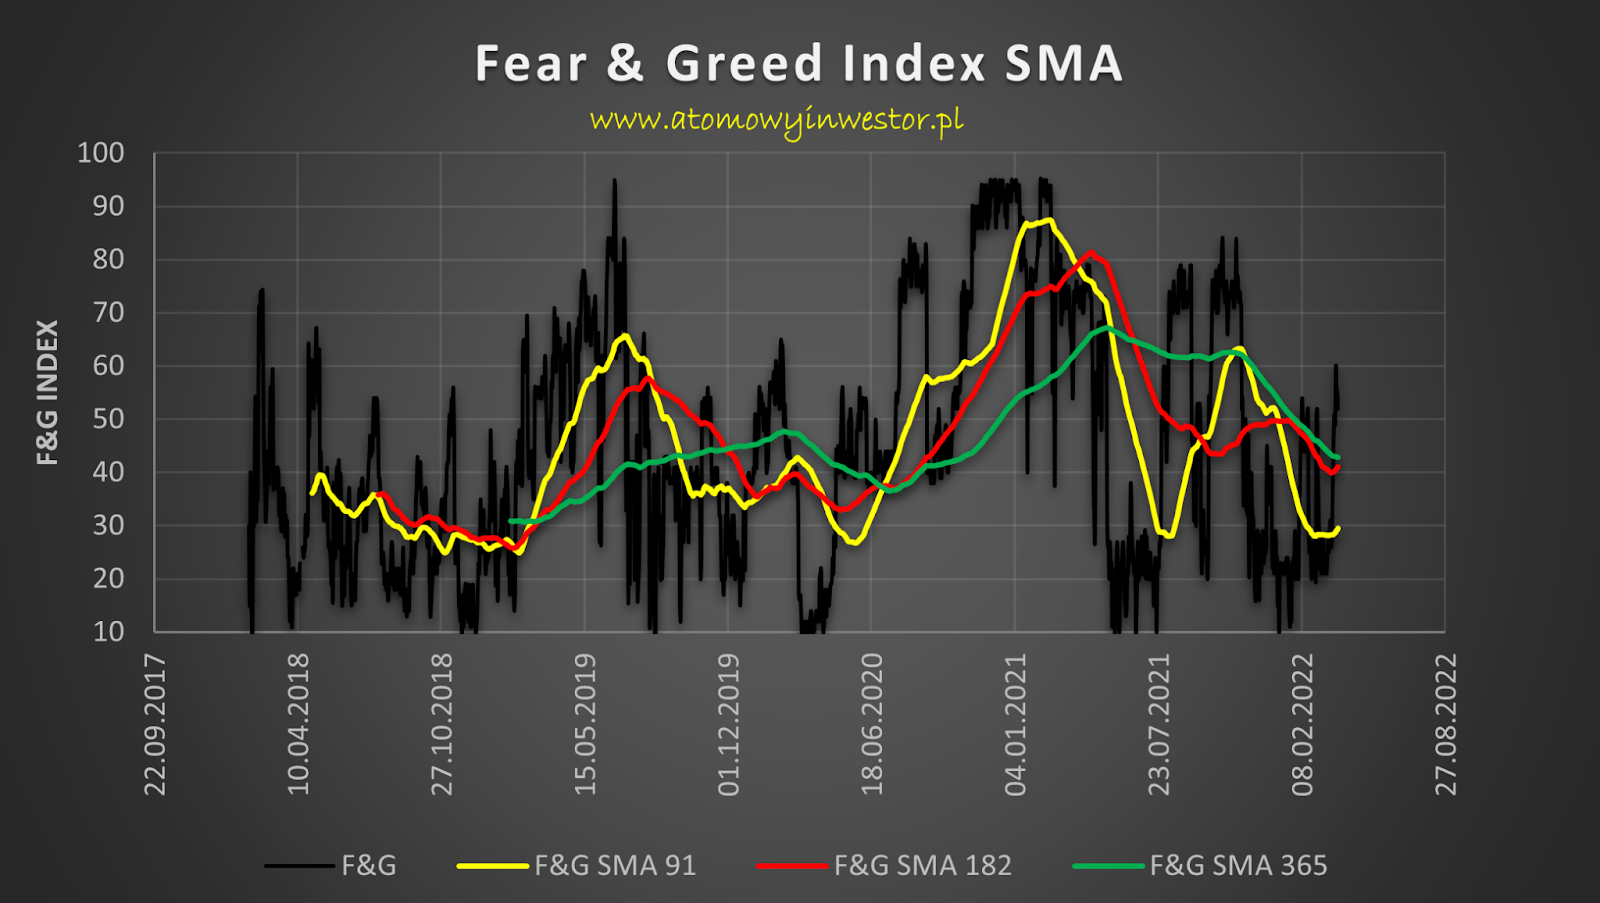
The key to analyzing moving averages is choosing the appropriate time period from which to calculate the moving average. You can talk about short-term, medium-term and long-term moving averages, the most common being 50-SMA, 100-SMA and 200-SMA. The values 50, 100, and 200 determine the number of recent sessions from which to average. Bitcoin cycles are believed to last around 4 years, somewhat dictated by halvings. Therefore, moving averages of 365 days (annual SMA), 191 days (semi-annual SMA) and 91 days (quarterly SMA) were used for the analysis.
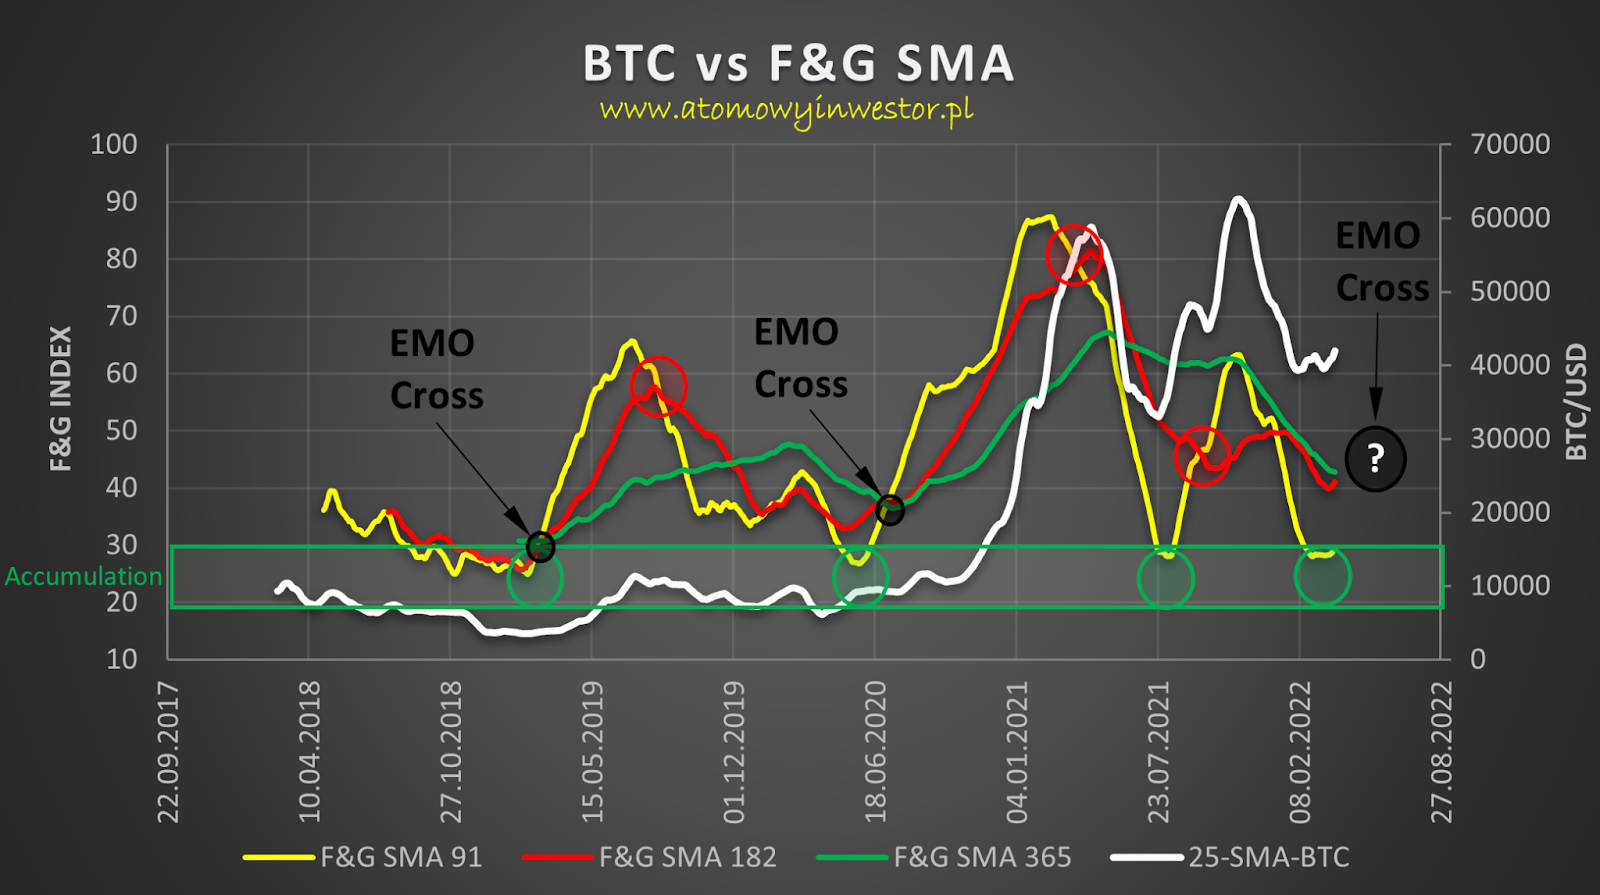
Conclusions from Long-Term Analysis of the Fear and Greed Index
Analysis of the BTC vs. F&G SMA chart allowed us to draw some key conclusions:
- The best time to accumulate Bitcoin is when the quarterly 91 SMA F&G is in the green in the 20-30 F&G range.
- A cross of the 182 biannual SMA F&G from above through the 91 SMA quarterly F&G (death cross) indicated the moment to exit the market. At this point, the quarterly greed crossed the six-month greed, resulting in declines each time.
- The point at which the three moving averages, quarterly, semi-annual and yearly, crossed twice indicated the point after which the bull market began. Atomic Investor calls this point the “EMO Cross”.
- Much of the information from the F&G SMA trend analysis suggests that another EMO cross is possible in the coming weeks/months.

- It can also be observed that the quarterly 91-SMA F&G has twice adopted a distinctive pattern (black curve). In the periods 2018-2020 and 2020-2022 there was initially a great deal of euphoria, followed by a recovery and renewed euphoria. Can such a pattern be repeated? In this case, the end of such emotional behavior would be just before the next halving, which is estimated for Q2/Q3 2024.
- Additionally, the annual 365 SMA F&G plots an ascending base (white dashed line). This may indicate that fear in the cryptocurrency market is becoming smaller in the long-term, meaning it lasts shorter relative to greed/neutrality. Conversely, this could be related to greater cryptocurrency adoption, greater awareness, more HODLers, and greater utility of blockchain technology.
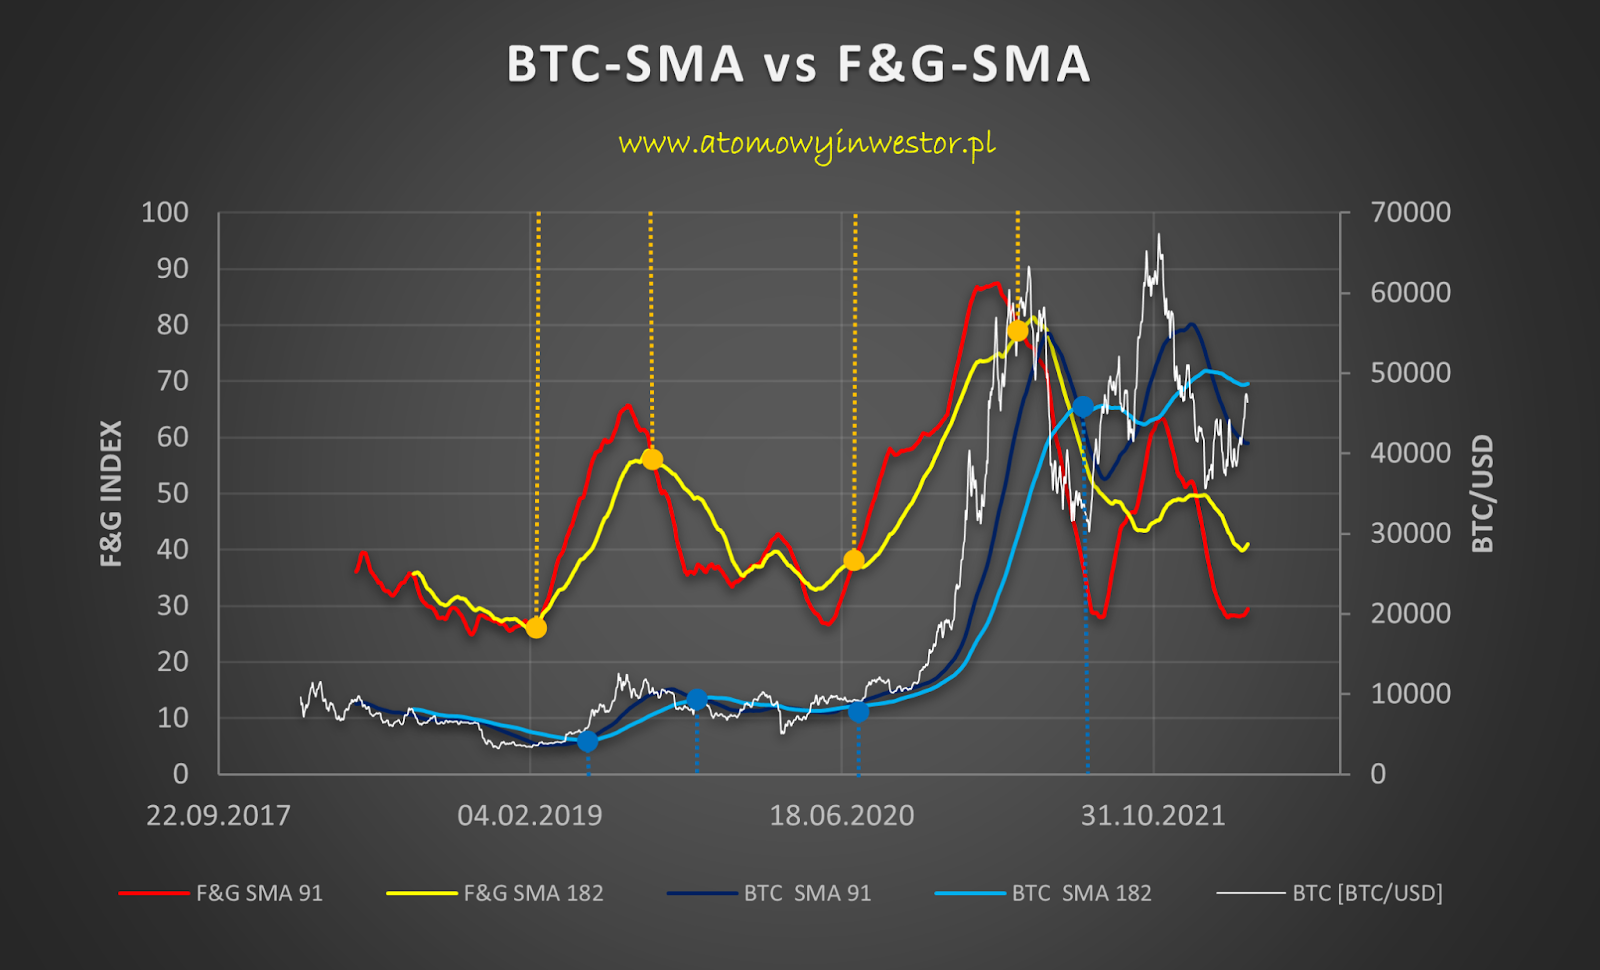
- Finally, the moving average crosses for the Fear and Greed Index were compared to the Bitcoin price moving average crosses. Average values from the same periods were used – quarterly and semi-annually. From the analysis it can be concluded that emotions determine the price and not the price emotions. An increase in euphoria occurs before the price rises and fear occurs near the price peak.
summary
An in-depth analysis of the Fear and Greed Index by calculating various moving averages has allowed it to be interpreted in a broader range. This suggests that sentiment in the cryptocurrency market is cyclical.
Proper interpretation and assumptions give reason to believe that cryptocurrency market sentiment moving averages can be a good indicator to suggest turning points in the price of Bitcoin. Thus, they can be used for long-term investments in the most important cryptocurrency.
If you want to keep up to date with this indicator, follow Atomic Investor on Twitter and visit his Atom blog.
– – –
Atomic Investor
Trend detective and enthusiast for cryptocurrencies and precious metals. A proponent of the atomic approach to personal development. A PhD in science gives him the feeling of being able to relate theoretical and empirical data and draw meaningful conclusions. However, reality confirms his hypotheses.
What do you think about this topic? Write to us and tell us!
Disclaimer
All information contained on our website is published to the best of our knowledge and belief and for general information purposes only. Any actions taken by the reader based on the information contained on our website are entirely at your own risk.
Learn Crypto Trading, Yield Farms, Income strategies and more at CrytoAnswers
https://nov.link/cryptoanswers
Comments are closed.