


ETH/BTC Analysis:
- Bitcoin is down 30% from the recent high, compared to Ethereum’s 18.5% at current levels
- The technical design of ETH/BTC aims to exploit the relative strength of ether versus bitcoin
Crypto Assets and Inflation heading into 2022
Crypto markets in general have seen phenomenal price increases due to their great appeal as a hedge against inflation. As inflation lingers, talk of measures to combat it has increased, and major central banks like the Fed have begun to see the longer-term implications of persistent inflation. Rates markets have raised their expectations for rate hikes into 2022, although those expectations have proven to have changed or self-corrected in response to central bank policy statements or the development of news about the Omicron variant.
With a big focus on controlling inflation, major crypto assets like Bitcoin and Ethereum have retreated from recent highs, but Ethereum appears to have weathered the storm better than its Bitcoin counterpart. Ethereum is down 18.5% from the recent high, compared to Bitcoin’s more than 30% drop
Ethereum is holding up throughout the recent decline
While showing a short-term directional move down, Ether remains within the longer-term uptrend as the ascending trendline – which acts as support – remains intact. As long as this remains the case, ether bulls could see a bounce off support as an opportunity to re-enter the longer-term uptrend, either via ETH itself or via the ETH/BTC pair.
With this in mind, the potential for a longer move lower cannot be ruled out. That MACD has just moved below the zero line, so anticipating the move should be avoided.
Ethereum (ETC) daily chart
Diagram created by Richard SnowI G
Bitcoin falls almost a third from the last high
Compared to ether, bitcoin has seen a more drastic decline since the recent high and subsequently fell below the ascending trend line. The largest cryptocurrency by market cap is trading just below the psychological level of 50,000, which remains the next level Resistance. Subsequent failed attempts to reach 50,000 could be symptomatic of further future declines.
Bitcoin daily chart
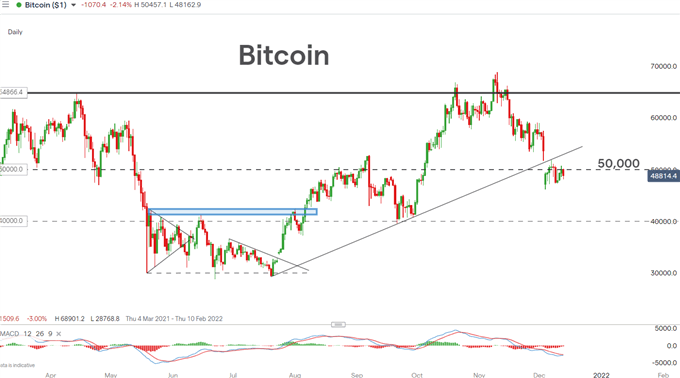
Diagram created by Richard SnowI G
ETH/BTC Technical Setup
A stronger ether versus bitcoin establishes the potential for upside in ETH/BTC as the pair tests the previous high (March 2021) at 0.08160. A bounce off this level could see the pair move back towards the all-time high that was printed just a few days ago.
Ethereum/Bitcoin (ETH/BTC) daily chart
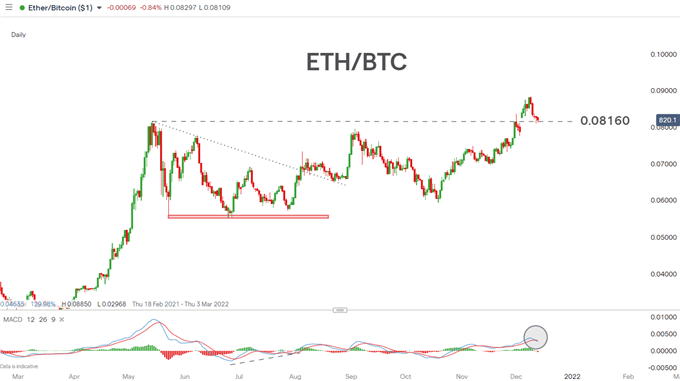
Diagram created by Richard SnowI G
— Written by Richard Snow for DailyFX.com
Contact and follow Richard on Twitter: @RichardSnowFX
element within element. This is probably not what you wanted to do! Instead, load your application’s JavaScript bundle into the element.
Learn Crypto Trading, Yield Farms, Income strategies and more at CrytoAnswers
https://nov.link/cryptoanswers
Comments are closed.