


Bitcoin (BTC) and Ethereum (ETH) prices have risen significantly in 2023, while XRP has lagged.
The price movements and indicator values of the three cryptocurrencies show significantly different trends.
Are cryptos at risk of a reversal?
A recent post from Santiment noted that a large portion of the Bitcoin, Ethereum and XRP supply generates profits. To be more precise, over 80% of the total supply is profits.
Santiment chart. Source: Santiment
Historically, the 55-75% range was considered average, while movements above and below this range were considered higher and lower risk, respectively.
Let's look at the price movements for Bitcoin, Ethereum and XRP and determine if a correction is imminent.
Bitcoin price breaks from the pattern
The Percent Supply in Profit (PSP) indicator shows the amount of total supply that is in profit. Of course, it approaches 100% as the price of an asset approaches its all-time high, and reaches 100% as soon as it breaks its all-time high.
Currently, the PSP for Bitcoin is 85%.
Looking at the BTC price movement of the previous two market cycles reveals an interesting development. More specifically, when PSP rose above 80 (black) for the first time after the low, a significant correction followed.
This was visible in both 2014 and 2018 (red circle). Interestingly, the PSP has risen to over 80% after hitting its low point in 2022.
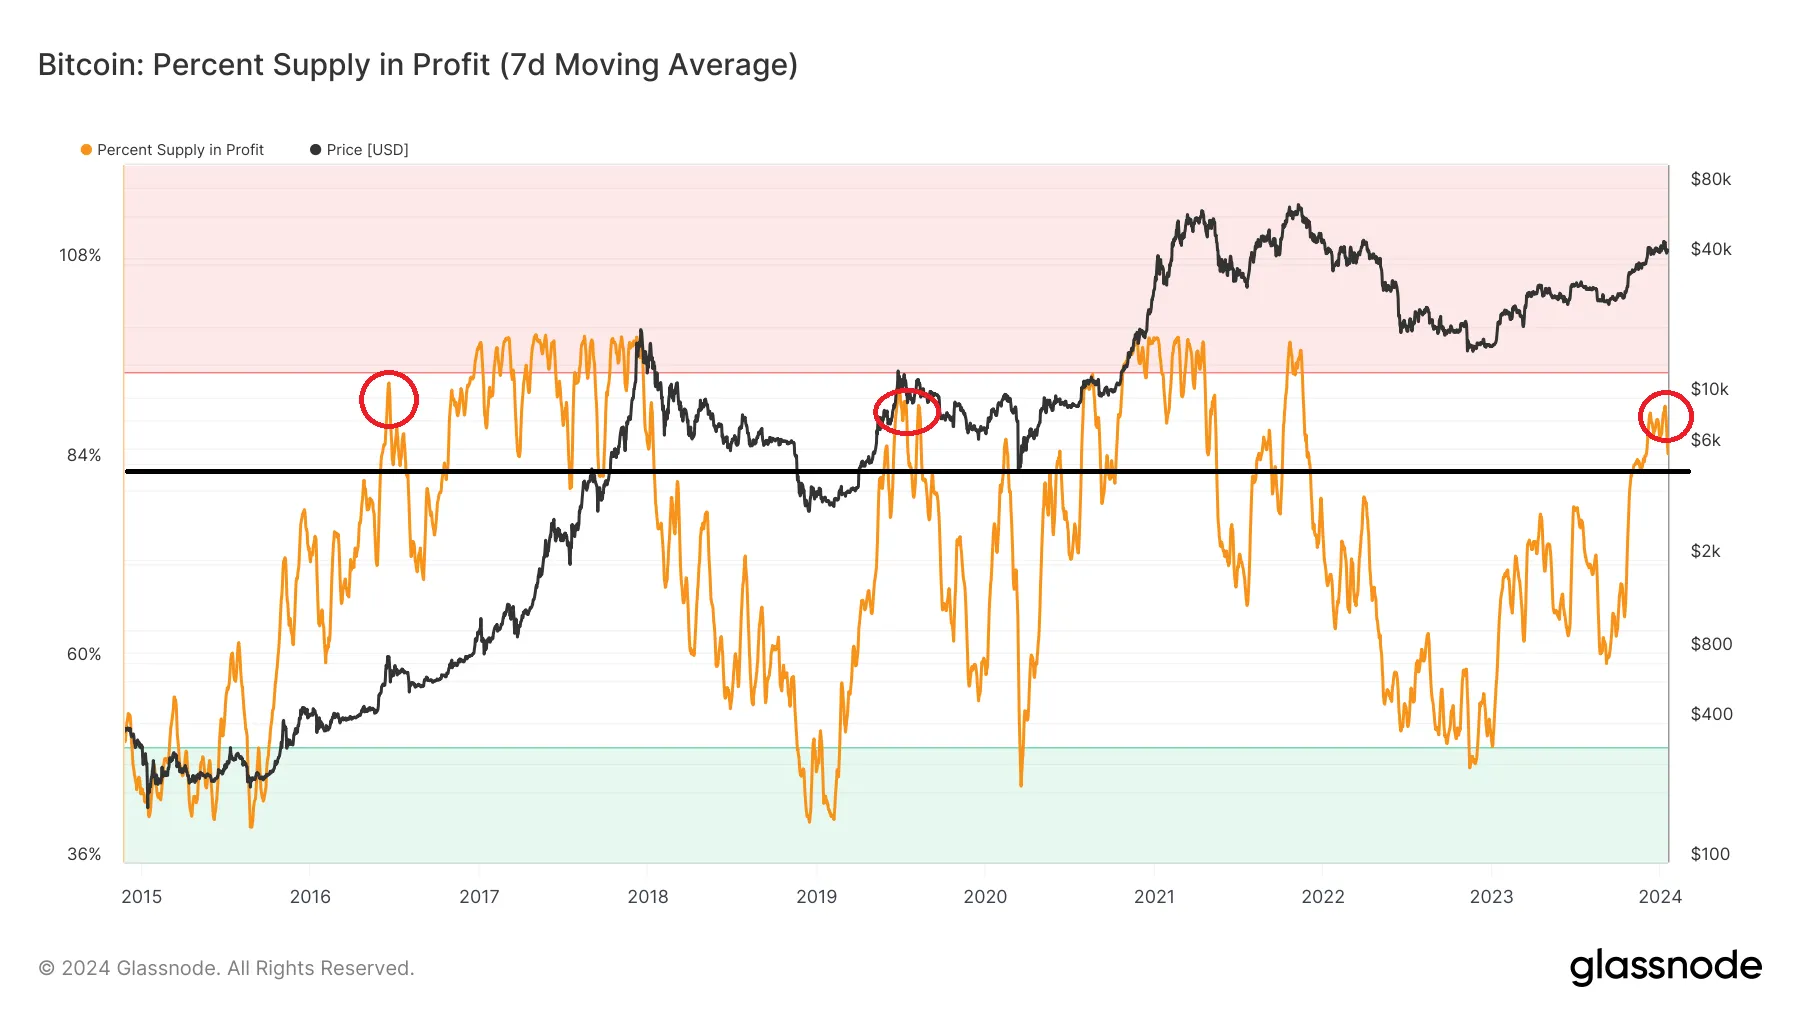 Percentage offer in profit chart. Source: Glassnode
BTC price action matches this bearish development. The daily time frame shows that BTC has fallen since reaching a high of $48,970 on January 11, 2024. The decline led to a breakout of an ascending parallel channel the next day. Bitcoin confirms the channel as resistance.
The daily RSI supports the breakdown. Traders use the RSI as a momentum indicator to assess whether a market is overbought or oversold. Bulls still have an advantage when the RSI value is above 50 and the trend is up. The opposite is true if the reading is below 50.
The daily RSI created a bearish divergence (green) at the high. This happens when a price increase is accompanied by a decrease in momentum. Then the RSI fell below 50 (red symbol) for the first time since October 2023 (green symbol). Signs suggest that Bitcoin has reached a local high.
If the decline continues, BTC could fall by 12% to the next support at $37,700.
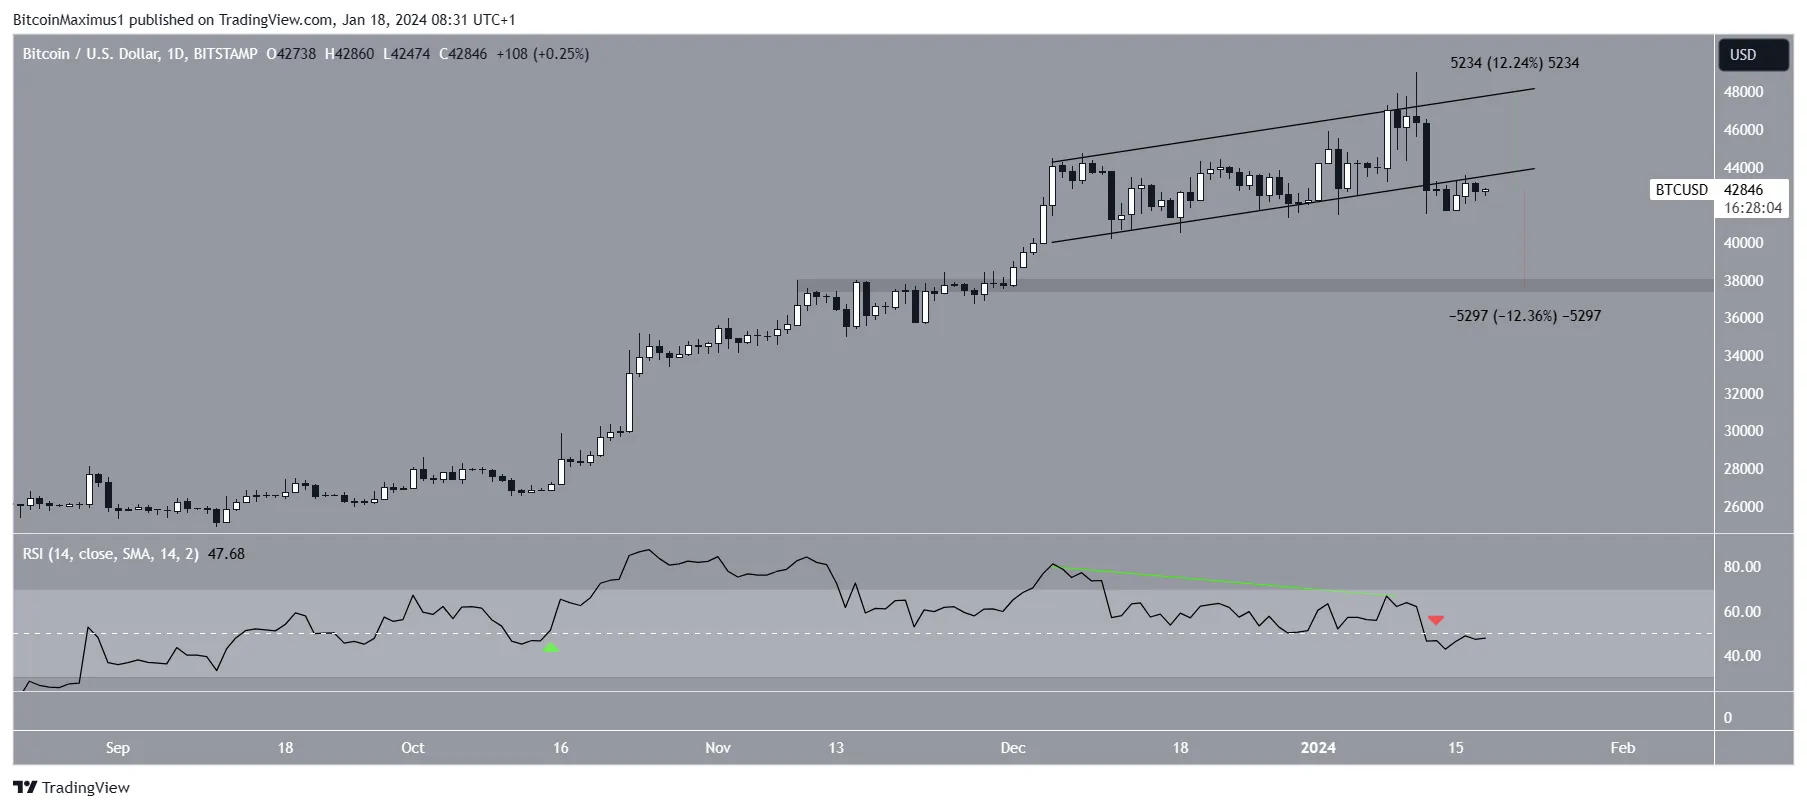 BTC/USD daily chart. Source: TradingView
Despite this bearish BTC price prediction, reclaiming the channel's support trendline could trigger a 12% rise to the resistance at $48,000.
Read more: What is a Bitcoin ETF?
Ethereum price is consolidating above resistance
Unlike BTC, the price action of ETH is not as pessimistic. This is because ETH has broken out of the horizontal $2,350 area, which has acted as both support and resistance at times since May 2021. Furthermore, the price achieved a weekly close above this level.
Such a breakout above a crucial resistance area is an extremely bullish development. The fact that the RSI is rising and has just moved into overbought territory legitimizes the bullish move.
If the increase continues, ETH may reach the next resistance at $3,500, almost 40% above the current price.
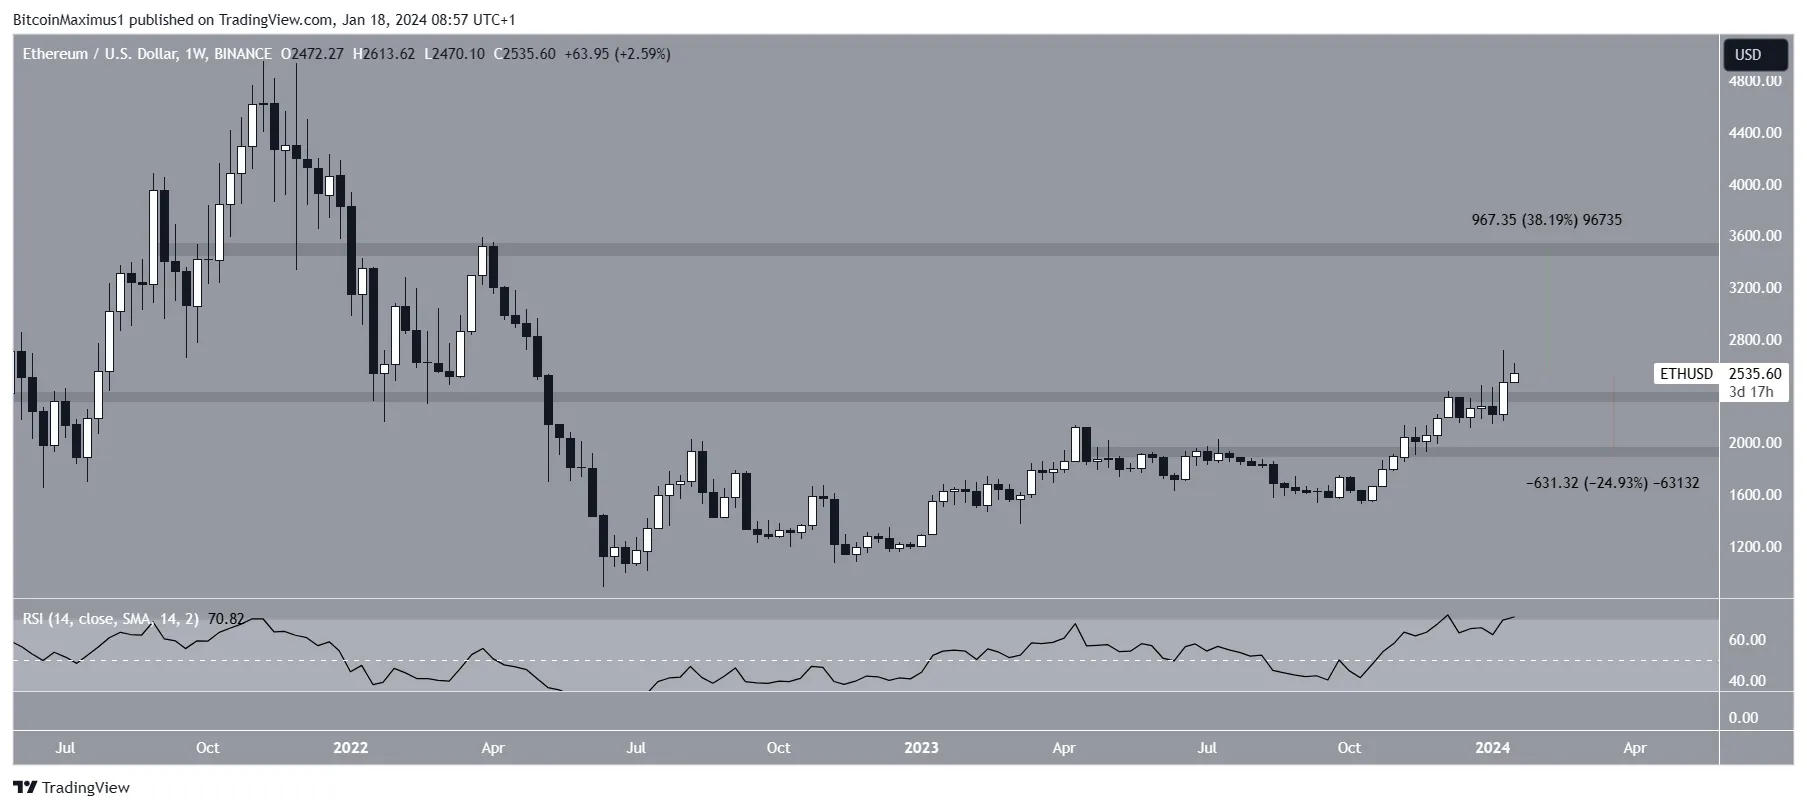 ETH/USD weekly chart. Source: TradingView
Despite this bullish ETH price prediction, a close below $2,350 will invalidate the ongoing breakout. Then the price can fall by 25% to the next support at $1,900.
Read more: How to buy Ethereum (ETH) and everything you need to know
XRP is hovering below resistance
While the BTC chart looks bearish and the ETH chart looks bullish, XRP is showing an indefinite trend. This is due to both price action and RSI values.
Price action shows that XRP has fallen below a descending resistance trendline since July. Recently, the trend line caused a rejection on December 28, 2023. XRP price has not reached the trend line since then.
While the price is still above the $0.54 support level, it has almost returned to this level after a failed bounce. Furthermore, the RSI is below 50. Whether the XRP price falls below $0.54 or instead breaks out of the trend line can determine the future trend.
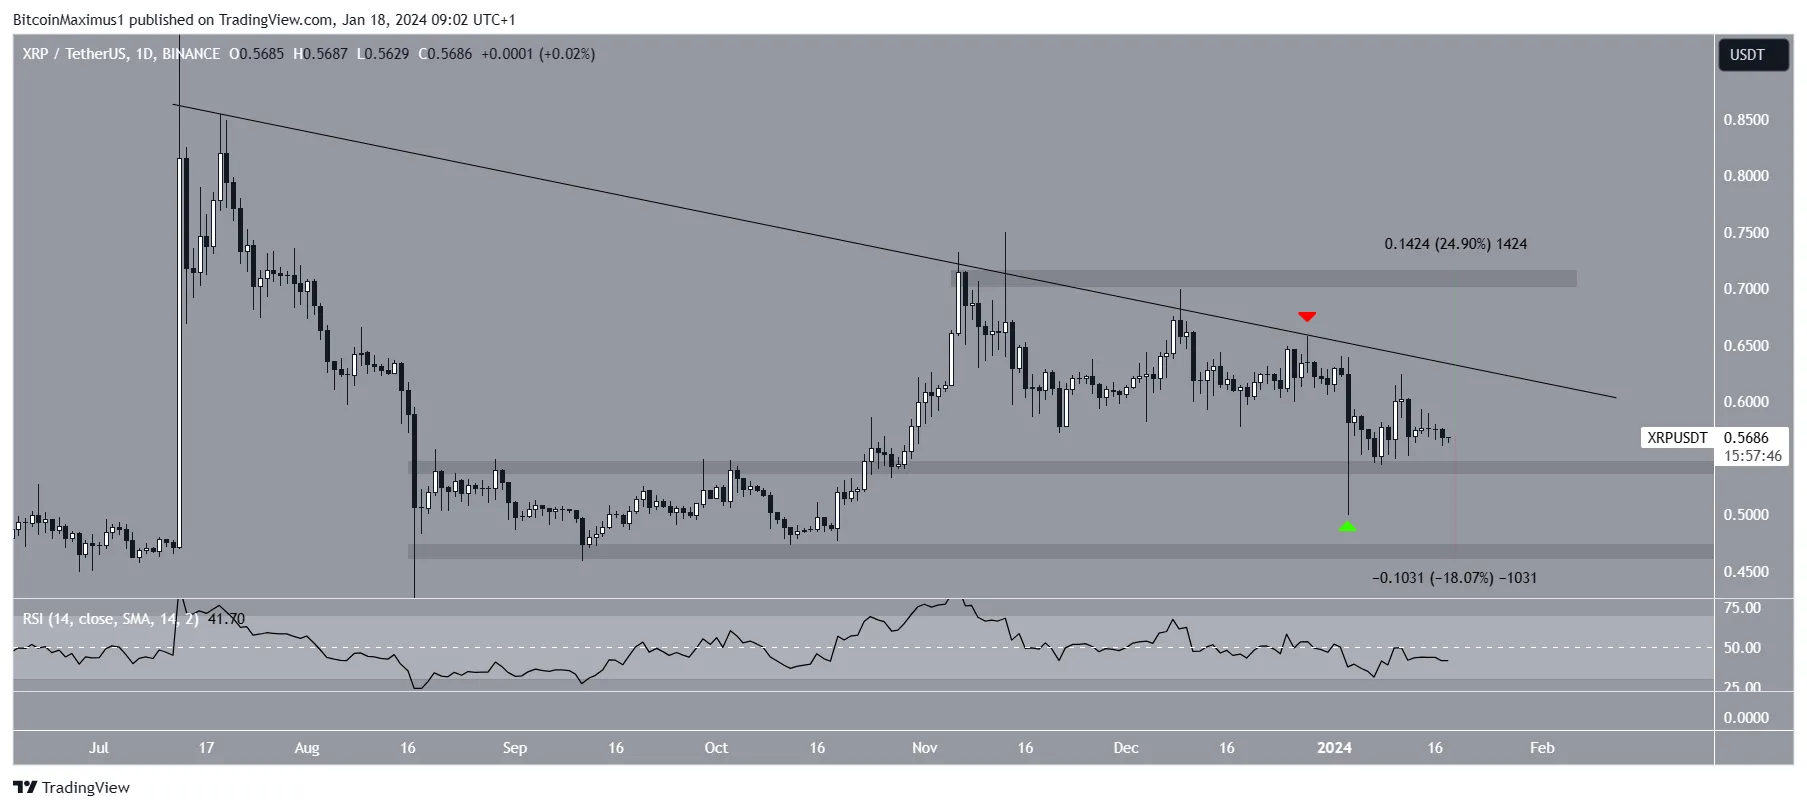 XRP/USDT daily chart. Source: TradingView
An XRP crash could result in an 18% price decline to the next support level at $0.47, while a breakout from the trendline could trigger a 25% price increase to the next resistance level at $0.72.
For the latest crypto market analysis from BeInCrypto, click here.
Disclaimer
In accordance with Trust Project policies, this pricing analysis article is for informational purposes only and should not be considered financial or investment advice. BeInCrypto is committed to accurate, unbiased reporting, but market conditions are subject to change without notice. Always do your own research and consult a professional before making any financial decisions. Please note that our Terms and Conditions, Privacy Policy and Disclaimers have been updated.
Learn Crypto Trading, Yield Farms, Income strategies and more at CrytoAnswers
https://nov.link/cryptoanswers
Comments are closed.